Anomaly Detection Using QoS Metrics and Business Intelligence
This article discusses anomaly detection using Quality of Service metrics for content streaming platforms using AWS components.
Join the DZone community and get the full member experience.
Join For FreeIn the contemporary data landscape, characterized by vast volumes of diverse data sources, the necessity of anomaly detection intensifies. As organizations aggregate substantial datasets from disparate origins, the identification of anomalies assumes a pivotal role in reinforcing security protocols, streamlining operational workflows, and upholding stringent quality standards. Through the application of sophisticated methodologies encompassing statistical analysis, machine learning, and data visualization, anomaly detection emerges as a potent instrument for uncovering latent insights, mitigating risks, and facilitating real-time decision-making processes.
This article centers on a focused application scenario: the detection of anomalies within a video/audio streaming platform to gauge real-time content delivery quality. Our objective is clear: to assess the quality of streaming video/audio content, ultimately enhancing the customer experience. Central to this discussion is the utilization of Quality of Service (QoS) metrics, complemented by GEO-IP services, to enrich data capture and facilitate proactive monitoring, detection, and intervention.
What Is Quality of Service?
Quality of service (QoS) refers to the measurement of the precision and reliability of the services provided to a platform, assessed through various metrics. It's a commonly employed concept in networking circles to ensure the optimal performance of a platform. This article focuses on establishing QoS metrics tailored specifically for video or audio content. We achieve this by extracting necessary metrics at the client edge (customer devices) and enhancing their attributes to provide deeper insights for business purposes.
Why Quality of Service?
The importance of "quality of service" lies in its ability to fulfill the specific needs of consumers. For instance, when customers are enjoying a live sports event through OTT streaming platforms like YouTube, it becomes paramount for the streaming company to assess the video quality across various regions. This necessity extends beyond video streaming to other sectors such as podcasting, audiobooks, and even award streaming services.
How QoS Metrics Can Help in Anomaly Detection
Integral to anomaly detection, QoS metrics furnish essential data and insights to pinpoint abnormal behavior and potential security risks across applications, systems, and networks. Continuous monitoring of metrics such as buffering ratio, bandwidth, and throughput enables the detection of anomalies through deviations from established thresholds or behavioral patterns, triggering alerts for swift intervention. Furthermore, QoS metrics facilitate root cause analysis by pinpointing underlying causes of anomalies, guiding the formulation of effective corrective actions.
We need to design a solution in order to identify anomalies in three states: New York, New Jersey and Tamil Nadu for a streaming platform and ensure smooth streaming quality. We will leverage AWS components to compliment this solution.
How Can We Solve This Problem Using Streaming Architecture?
To comprehensively analyze the situation, we require additional attributes beyond just geographical location. For instance, in cases of streaming quality issues, organizations must ascertain whether the problem stems from the Internet Service Provider or if it is linked to recent code releases, potentially affecting specific operating systems on devices.
Overall, there's a need for a Quality of Service (QoS) API service capable of collecting pertinent data from the client devices and relaying it to an API, which in turn disseminates these attributes to downstream components. With the initial details provided by the client, the downstream components can enhance the dataset. The JSON object below illustrates the basic information transmitted by the client device for a single event.
Sample JSON event from client device:
{
"video_start_time":"2023-09-10 10:30:30",
"video_end_time":"2023-09-10 10:30:33",
"total_play_time_mins" : "60",
"uip":"10.122.9.22",
"video_id":"xxxxxxxxxxxxxxx",
"device_type":"ios",
"device_model":"iphone11"
}

Architecture Option 1
The application code on the device can call the API Gateway, linked to a Kinesis proxy, which connects to a Kinesis Stream. This setup facilitates near real-time analysis of client data at this layer. Subsequently, data transformation can occur using a Lambda function, followed by storage in S3 for further analysis. This architecture addresses two primary use cases: firstly, the capability to analyze incoming QoS data in near real-time through Kinesis Stream, leveraging AWS tools like Kinesis Analytics for ad-hoc analytics with reduced latency. Secondly, the ability to write data to S3 using a simple Lambda code allows for batch analytics to be conducted.

Mentioned approach effectively addresses scalability concerns in a streaming solution by leveraging various AWS components. In our specific use case, enriching incoming data with geo IP locations is essential, since we need information like country, state and ISP's. To achieve this, we can utilize a geo API, such as max mind, to incorporate geo-location, IP address, and other relevant dimensions. Alternatively, let's explore an architecture that assumes analytics are performed every minute, eliminating the need for a streaming layer and focusing solely on a delivery layer.
Architecture Option 2
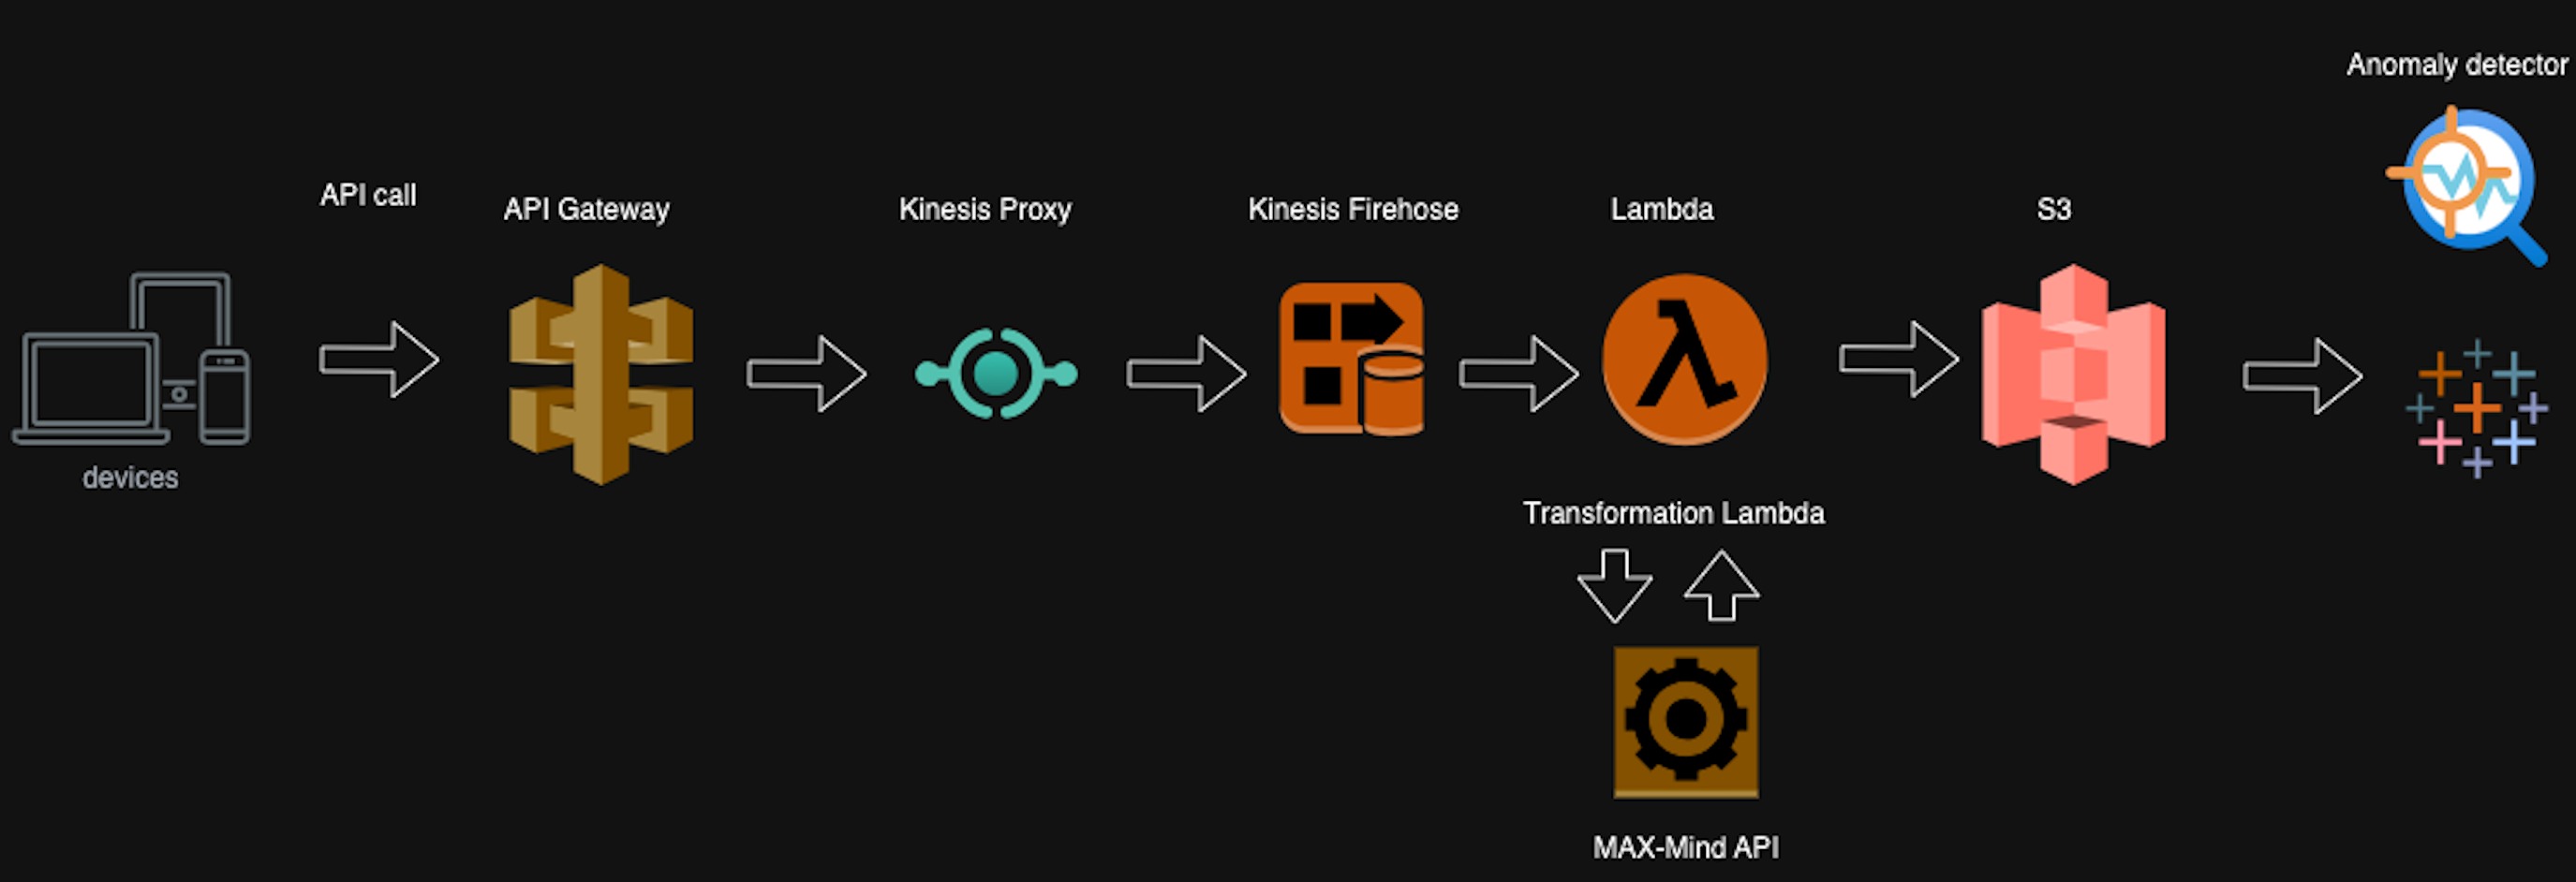
In this scenario, we'll illustrate the process of enriching data with geo and ISP-specific attributes to facilitate anomaly detection. Clients initiate the process by calling the API Gateway and passing along the relevant attributes. These values are then transmitted to the Kinesis Firehose via the Kinesis proxy. A transformation lambda function within the Kinesis Firehose executes a straightforward Python script to retrieve geo IP details from the MaxMind service. Subsequently, Kinesis Firehose batches the data and transfers it to S3. S3 serves as the central repository of truth for anomaly detection, housing all the necessary data for analysis.

Below is a sample code snippet for calling the service to retrieve geo-IP details. As depicted, the code primarily centers on retrieving information from the MaxMind .mdb file supplied by the provider. Various methods exist for obtaining geo IP data; in this instance, I've chosen to have the .mdb file accessible via an S3 path. Alternatively, you can opt to retrieve it through API calls. The enriched data is then returned to Kinesis Firehose, where it undergoes batching, compression, and subsequent delivery to S3.
import base64
import json
import geoip2.database

s3_city_url = "<maxmind_s3_url_path_for_city_details_mmdb_file>"
s3_isp_url = "<maxmind_s3_url_path_for_isp_details_mmdb_file>"

opener = ur.URLopener()
city_file = opener.open(s3_city_url).read()
isp_file = opener.open(s3_isp_url).read()

def qos_handler(event, context):
    def enrichRecord(record):
        try:
            decodedata2 = base64.b64decode(record['data'])
            streaming_event_object = json.loads(decodedata2.decode("utf-8"))

            reader = geoip2.database.Reader(city_file, mode='RAW_FILE')
            response_data = reader.city(streaming_event_object['uip'])

            reader_isp_data = geoip2.database.Reader(isp_file, mode='RAW_FILE')
            response_isp_data = reader_isp.isp(streaming_event_object['uip'])

            streaming_event_object['cityname'] = response_data.city.name
            streaming_event_object['postalcode'] = response_data.postal.code
            streaming_event_object['metrocode'] = response_data.location.metro_code
            streaming_event_object['timezone'] = response_data.location.time_zone
            streaming_event_object['countryname'] = response_data.country.name
            streaming_event_object['countryisocode'] = response_data.country.iso_code
            streaming_event_object['origip'] = streaming_event_object['uip']
            streaming_event_object['ispname']=response_data.isp

            jsonData = json.dumps(streaming_event_object)
            encoded_streaming_data = base64.b64encode(jsonData.encode("utf-8"))

            return {
                'recordId': record['recordId'],
                'result': "Ok",
                'data': encoded_streaming_data.decode("utf-8")
            }

        except Exception as e:
            print("type of e:",type(e))
            print("exception as e:",e)

    print("event[records]-input:",event['records'])
    output = list(map(enrichRecord, event['records']))
    print("output:",output)


    return {'records': output}
Analytics on Streamed Data
After the data reaches S3, we can conduct ad-hoc analytics on it. Various options are available for analyzing the data once it resides in S3. It can be loaded into a data warehousing platform such as Redshift or Snowflake. Alternatively, if a data lake or data mesh serves as the source of truth, the data can be replicated there. During the analysis in S3, we primarily calculate the buffering ratio using the following formula:
The ratio is obtained by dividing the buffering time by the total playtime.
In this example so we are calculating the buffering ratio as below,

In our example:
"video_start_time":"2023-09-10 10:30:30",
"video_end_time":"2023-09-10 10:30:33",
"total_play_time_mins" : "60",

Buffering_ratio = diff(video_end_time,video_start_time)/total_play_time_mins
Buffering_ratio = (3/3600) = 0.083
Detecting Anomalies
To continue further, the following attributes will be available as rows in tabular format during the ETL operation at the Data Warehousing (DWH) stage. These values will be stored for each video/audio ID. By establishing a materialized view for the set of records stored over a certain period, we can compute an average value and percentages of the buffering ratio metric mentioned earlier.
Sample JSON event with buffering ratio:
{
"video_start_time":"2023-09-10 10:30:30",
"video_end_time":"2023-09-10 10:30:33",
"total_play_time_mins" : "60",
"uip":"10.122.9.22",
"video_id":"xxxxxxxxxxxxxxx",
"device_type":"ios",
"device_model":"iphone11",
"Buffering_raio":"0.083",
"uip":"10.122.9.22",
"video_id":"xxxxxxxxxxxxxxx",
"isp":"isp1",
"country":"USA",
"state":"NJ"
}
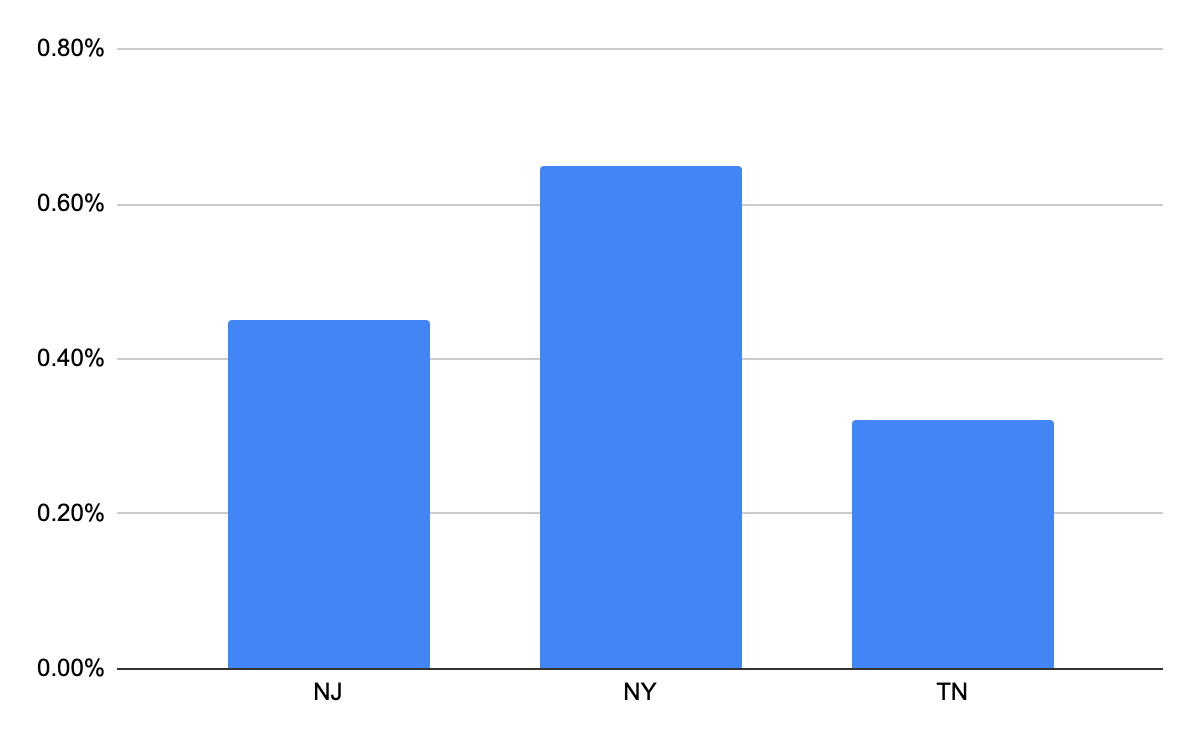
For simplicity, let's focus on one metric — buffering ratio — to gauge the streaming quality of sports matches or podcasts for customers. After capturing the real-time events and visualizing the tabular data, It is obvious NY exhibits a higher buffering ratio (out of the 3 states the organization is interested in), indicating that viewers may experience sluggish content delivery. This observation prompts further investigation into potential issues related to ISPs or networking by delving into other dimensions gathered from GEO-IP or device attributes.

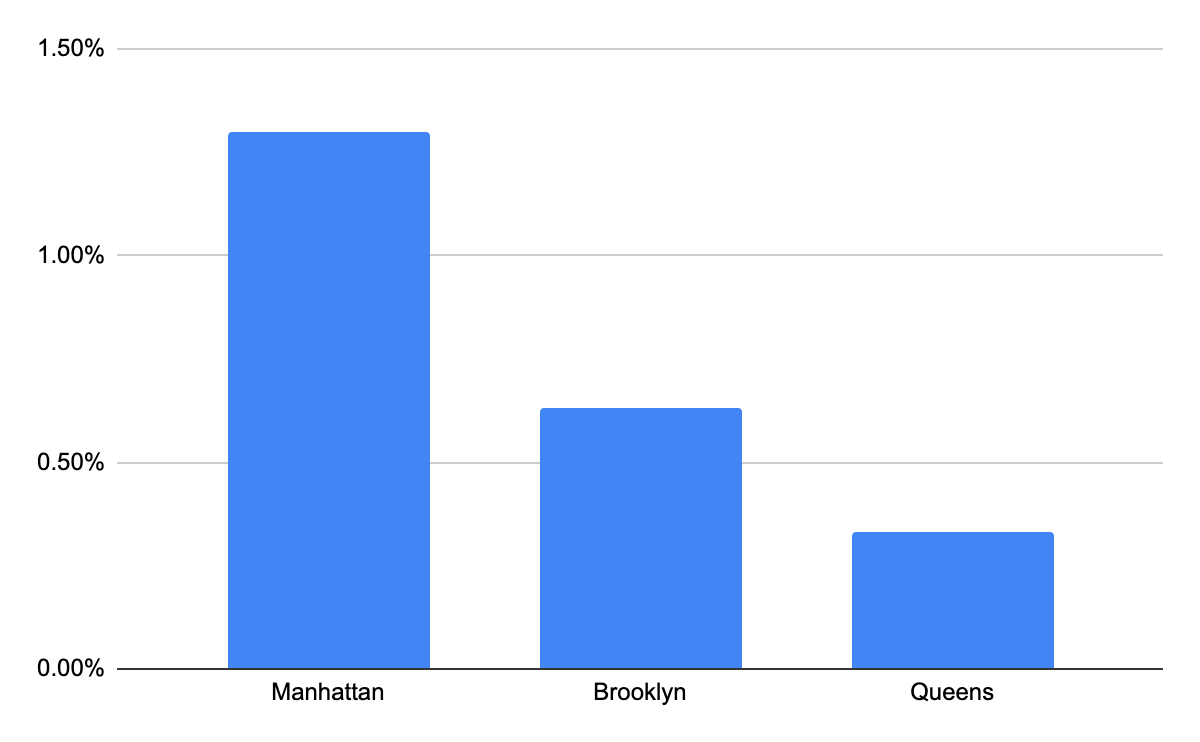
As the first step content providers choose to delve deeper into geographical dimensions at the city level, and they identify that Manhattan in New York has the highest buffering ratio among top 3 cities in NY having higher buffering ratios.

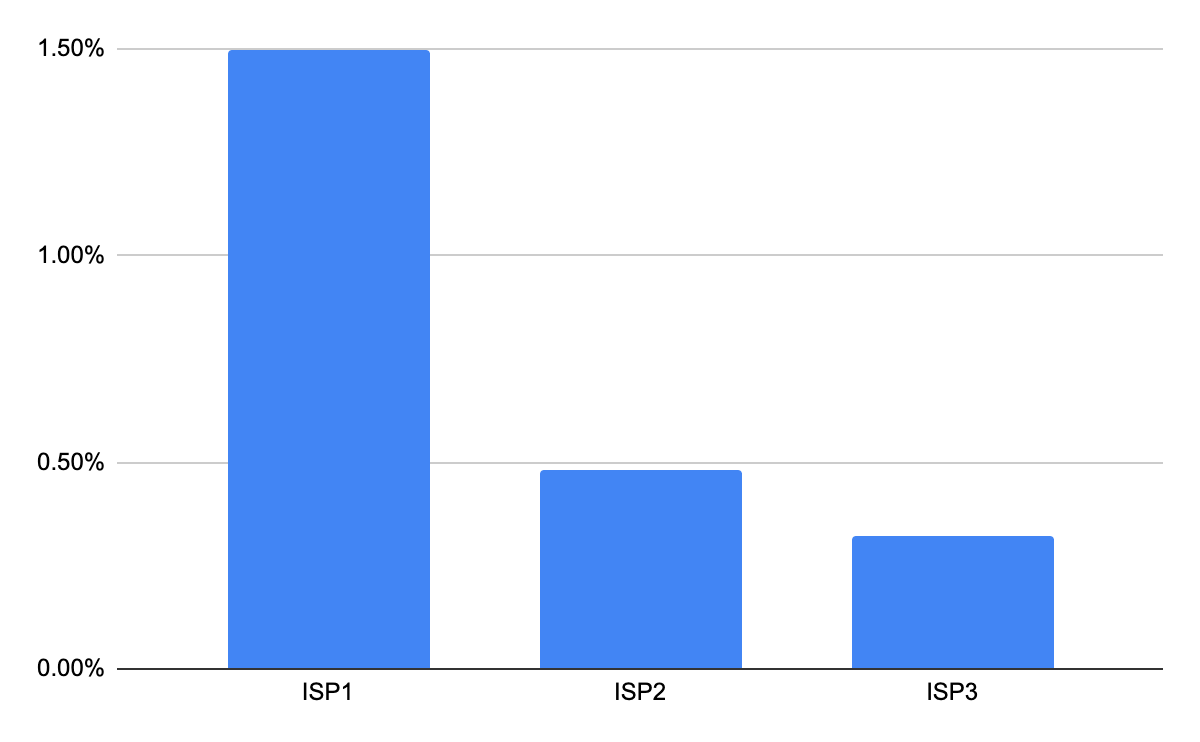
Following this, content providers delve into the metrics associated with internet service provider (ISP) details specifically for Manhattan to identify potential causes. This examination uncovers that ISP1 exhibited a higher buffer ratio, and upon further investigation, it appears that ISP1 encountered internet speed issues only in Manhattan. These proactive analyses empower content providers to detect anomalies and evaluate their repercussions on consumers in particular regions, thereby proactively reaching out to consumers. Comparable analyses can be expanded to other factors such as device types and models.

These steps demonstrate how anomaly detection can be carried out with robust data engineering, streaming solutions, and business intelligence in place. These data intrun can be us used for Machine learning algorithms as well for enhanced detections.
Conclusion
This article delved into leveraging QoS metrics for anomaly detection during content streaming in video or audio applications. A particular emphasis was placed on enriching data with GEO-IP details using the MAXMIND service, facilitating issue triage to specific dimensions such as country, state, county, or ISPs. Architectural options were also presented for implementing streaming solutions, accommodating both ad-hoc near real-time and batch analytics to pinpoint anomalies.
I trust this article serves as a helpful starting point for exploring anomaly detection approaches within your organization. Notably, the discussed solution extends beyond OTT platforms, being applicable to diverse domains such as the financial sector, where near real-time anomaly detection is essential.
Opinions expressed by DZone contributors are their own.

Comments