Python Memory Issues: Tips and Tricks
Like most garbage collected languages, memory management in Python is indirect; you have to find and break references to unused data to help the garbage collector keep the heap clean.
Join the DZone community and get the full member experience.
Join For FreePython intends to remove a lot of the complexity of memory management that languages like C and C++ involve. It certainly does do that, with automatic garbage collection when objects go out of scope. However, for large and long running systems developed in Python, dealing with memory management is a fact of life.
In this blog, I will share thoughts on reducing Python memory consumption and on root-causing Memory consumption/bloat issues. These have been formulated from the learnings we’ve had while building Datos IO’s RecoverX Distributed Backup and Recovery platform, which is developed primarily in Python (has some components in C++, Java, and bash too).
Python Garbage Collection
The Python interpreter keeps reference counts to objects being used. When an object is not referred to anymore, the garbage collector is free to release the object and get back the allocated memory. For eg: if you are using regular Python (that is, CPython, not JPython) this is when Python’s garbage collector will call free()/delete()
Useful tools
Resource
‘resource’ module for finding the current (Resident) memory consumption of your program
[Resident memory is the actual RAM your program is using]
>>> import resource
>>> resource.getrusage(resource.RUSAGE_SELF).ru_maxrss
4332
objgraph
‘objgraph’ is a useful module that shows you the objects that are currently in memory
[objgraph documentation and examples are available at: https://mg.pov.lt/objgraph/]
Let's look at this simple usage of objgraph:
import objgraph
import random
import inspect

class Foo(object):
   def __init__(self):
       self.val = None

   def __str__(self):
       return “foo – val: {0}”.format(self.val)

def f():
   l = []
   for i in range(3):
      foo = Foo()
      #print “id of foo: {0}”.format(id(foo))
      #print “foo is: {0}”.format(foo)
      l.append(foo)

   return l

def main():
   d = {}
   l = f()
   d[‘k’] = l
   print “list l has {0} objects of type Foo()”.format(len(l))

   objgraph.show_most_common_types()
   objgraph.show_backrefs(random.choice(objgraph.by_type(‘Foo’)),
filename=“foo_refs.png”)

   objgraph.show_refs(d, filename=‘sample-graph.png’)

if __name__ == “__main__”:
   main()
python test1.py

list l has 10000 objects of type Foo()
dict                       10423
Foo                        10000 ————> Guilty as charged!
tuple                      3349
wrapper_descriptor         945
function                   860
builtin_function_or_method 616
method_descriptor          338
weakref                    199
member_descriptor          161
getset_descriptor          107
Notice that we are also holding 10,423 instances of ‘dict’ in memory. Although we’ll come to that in a bit.
Visualizing the objgraph Dependencies
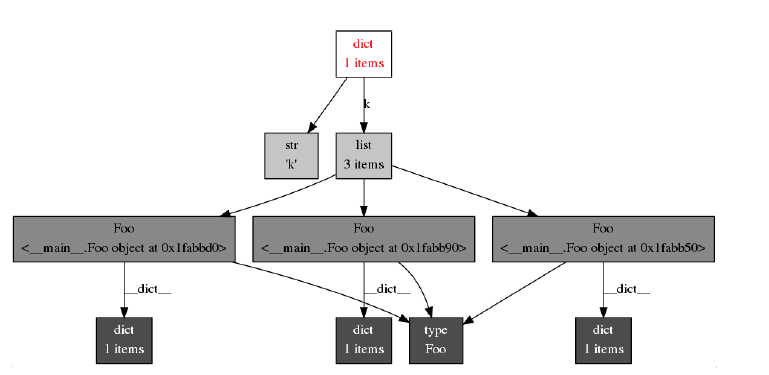
Objgraph has a nice capability that can show you why these Foo() objects are being held in memory. That is, who is holding references to them (in this case, it is the list ‘l’)
On RedHat/Centos, you can install graphviz using: sudo yum install yum install graphviz*
To see the objects the dictionary, d, refers to:
objgraph.show_refs(d, filename=’sample-graph.png’)

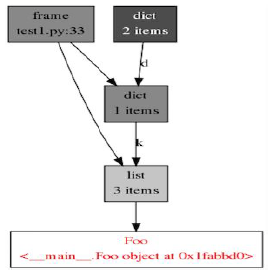
What is more interesting from a memory usage perspective, is — why is my Object not getting freed? That is, who is holding a reference to it.
This snippet shows how objgraph provides this info:
objgraph.show_backrefs(random.choice(objgraph.by_type(‘Foo’)),
filename=“foo_refs.png”)

In this case, we looked at a random object of type Foo. We know that this particular object is being held in memory because of its referrers back up the chain being in scope.
Sometimes, this can help when figuring out why Objects that we think are no longer used (referred to) are not being freed by Python’s garbage collector.
The challenge is sometimes knowing that Foo() is the class is holding a lot of memory. We can use heapy() to answer that part.
Heapy
Heapy is a useful tool for debugging memory consumption/leaks. See http://guppy-pe.sourceforge.net/. I have generally used heapy along with objgraph. I typically use heapy to see watch allocation growth of diff objects over time. Heapy can show which objects are holding the most memory etc. Objgraph can help in finding the backref chain (eg: section 4 above) to understand exactly why they cannot be freed.
My typical usage of heapy is calling a function like at different spots in the code to try to find where memory usage is spiking and to gather a clue about what objects might be causing the issue:
from guppy import hpy

def dump_heap(h, i):
   “””
   @param h: The heap (from hp = hpy(), h = hp.heap())
   @param i: Identifier str
   “””

   print “Dumping stats at: {0}”.format(i)
   print ‘Memory usage: {0} (MB)’.format(resource.getrusage(resource.RUSAGE_SELF).ru_maxrss/1024)
   print “Most common types:”
   objgraph.show_most_common_types()

   print “heap is:”
   print “{0}”.format(h)

   by_refs = h.byrcs
   print “by references: {0}”.format(by_refs)

   print “More stats for top element..”
   print “By clodo (class or dict owner): {0}”.format(by_refs[0].byclodo)
   print “By size: {0}”.format(by_refs[0].bysize)
   print “By id: {0}”.format(by_refs[0].byid)
Memory Reduction Tips
In this section I will describe a couple of tips that I’ve found to reduce memory consumption.
Slots
Use Slots for objects that you have a lot of. Slotting tells the Python interpreter that a dynamic dict is not needed for your object (From the example in 2.2 above, we saw that each Foo() object had a dict inside it)
Defining your class with slots makes the python interpreter know that the attributes/members of your class are fixed. And can lead to significant memory savings!
Consider the following code:
import resource
class Foo(object):
   #__slots__ = (‘val1’, ‘val2’, ‘val3’, ‘val4’, ‘val5’, ‘val6’)

   def __init__(self, val):
      self.val1 = val+1
      self.val2 = val+2
      self.val3 = val+3
      self.val4 = val+4
      self.val5 = val+5
      self.val6 = val+6

def f(count):
   l = []

   for i in range(count):
      foo = Foo(i)
      l.append(foo)

   return l

def main():
   count = 10000
   l = f(count)

   mem = resource.getrusage(resource.RUSAGE_SELF).ru_maxrss
   print “Memory usage is: {0} KB”.format(mem)
   print “Size per foo obj: {0} KB”.format(float(mem)/count)

if __name__ == “__main__”:
   main()
[vagrant@datosdev temp]$ python test2.py
Memory usage is: 16672 KB
Size per foo obj: 1.6672 KB
Now un-comment this line: #__slots__ = (‘val1’, ‘val2’, ‘val3’, ‘val4’, ‘val5’, ‘val6’)
[vagrant@datosdev temp]$ python test2.py
Memory usage is: 6576 KB
Size per foo obj: 0.6576 KBIn this case, this was a 60% Memory reduction!
Read more about Slotting here: http://www.elfsternberg.com/2009/07/06/python-what-the-hell-is-a-slot/
Interning: Beware of Interned Strings!
Python remembers immutables like strings (up to a certain size, this size is implementation dependent). This is called interning.
 >>> t = “abcdefghijklmnopqrstuvwxyz”
 >>> p = “abcdefghijklmnopqrstuvwxyz”
 >>> id(t)
 139863272322872

 >>> id(p)
 139863272322872
This is done by the python interpreter to save memory, and to speed up comparison. For eg, if 2 strings have the same id/reference – they are the same.
However, if your program creates a lot of small strings, you could be bloating memory.
Use Format Instead of ‘+’ for Generating Strings
Following from the above, when building strings, prefer to build strings using format instead of concatentation.
That is,
 st = “{0}_{1}_{2}_{3}”.format(a,b,c,d)   # Better for memory. Does not create temp strs
 st2 = a + ‘_’ + b + ‘_’ + c + ‘_’ + d # Creates temp strs at each concatenation, which are then interned
In our system, we found significant memory savings when we changed certain string construction from concat to format.
System Level Concerns
The tips I’ve discussed above should help you to hunt down memory consumption issues in your system. However, over time, the memory consumed by your python processes will continue to grow. This seems to be a combination of:
- How the C memory allocator in Python works. This is essentially memory fragmentation, because the allocation cannot call ‘free’ unless the entire memory chunk is unused. But the memory chunk usage is usually not perfectly aligned to the objects that you are creating and using.
- Memory growth also related to the “Interning” topic discussed above.
In my experience, it is only possible to reduce the rate at which the memory consumption grows in Python. What we have done at Datos IO, is to implement a worker model for certain memory hungry processes. For a sizeable unit of work, we spin up a worker process. When the worker processes work is done, it is killed — the only guaranteed way to return all the memory back to the OS :). Good memory housekeeping allows to increase the size of the work allocated, that is, allow the worker to run for a longer time.
Summary
I’ve described some tips to reduce memory consumption in python processes. When looking for memory leaks in your code, an approach is to use Heapy to find out which Objs are holding the most memory, and then possibly using Objgraph to find out why these are not getting freed (if you think they should).
Overall, I feel that hunting for memory problems in python is an art. Over time, you will develop better intuitions about where memory bloat and leaks are coming in your system, and will be able to solve them faster! Happy Hunting!
Related links
Other Python memory links I’ve found useful:
Published at DZone with permission of . See the original article here.
Opinions expressed by DZone contributors are their own.

Comments