Monitoring Self-Destructing Apps Using Prometheus
Learn how to configure Prometheus collectors and their use cases.
Join the DZone community and get the full member experience.
Join For Free
Prometheus is an open-source system monitoring and alerting toolkit. Data related to monitoring is stored in RAM and LevelDB nevertheless data can be stored to other storage systems such as ElasticSearch, InfluxDb, and others, https://prometheus.io/docs/operating/integrations/#remote-endpoints-and-storage
Prometheus can have alerting plugins as well, which will notify interested entities on certain events, like a breach of some SLA( Service Level Agreement). In this post, we'll see how to configure Prometheus collectors and their use cases.
General Prometheus Deployment

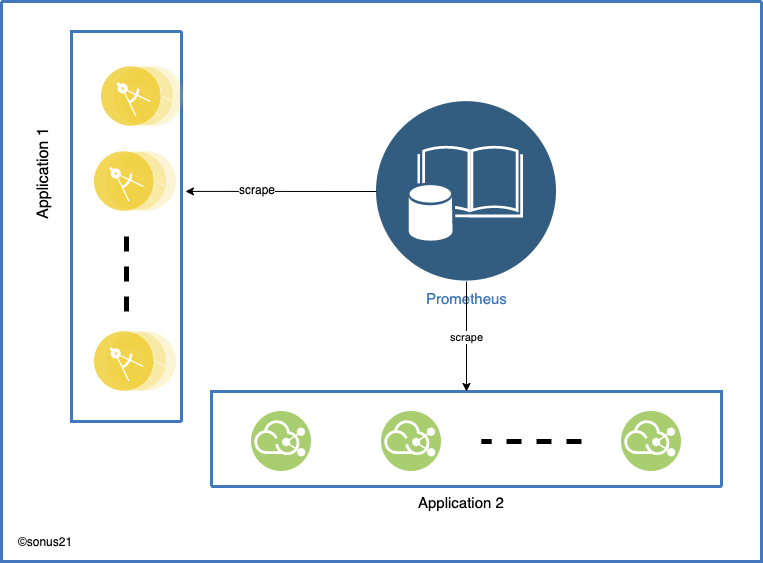
Once Prometheus is deployed it's configured to scrape data from some target, the specified end-point provides the metrics related data, it provides multiple configurations that can be used to scrape data from a specific server or set of servers. For example, we can configure to use EC2 config so that Prometheus can handle auto-scaling automatically.
Each application server/instance has to store the data related to that service until the scrape API is called. Scrape end-point will dump the data in the format understood by Prometheus. Storing data in local storage is required, which means we need to store metrics related data in application memory or provide some common storage system. Storing data in application memory has some pros and cons
Pros
- Do not require integration with another storage system
- No communication overhead
Cons
- On restart of the application, data is lost
- Memory footprint increases as the number of data points increases
HTTP Request Handling

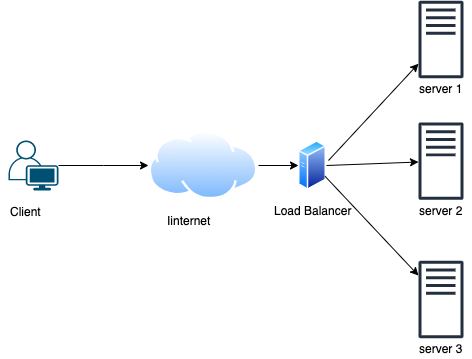
In the above picture, the client request goes through the internet and it reaches to load balancer that forwards the request to a specific server.
Each server handles the HTTP request differently depending on the application development programming language and server software like Apache2, Nginx, Tomcat, etc. There are two major designs, Muiltiprocess a server can have N number of application instances running in advance or also it can create a new process on the demand, due to the resource limitations on a server once a request is served application instance is destroyed (Python, Php, Ruby, etc applications).
Threading we have only one application instance and some N number of request handling threads each request is handover to one of the request handling thread given we have enough resources to serve a new request (Java, Go, Ruby, etc applications). Another one could be a combination of these two, in which we'd have some N (> 0) number of application instances running and each one can handle the request in a specific thread.
Self-Destructing Applications
Self-Destructing applications are destroyed automatically like Multprocess web-server application. A process can be terminated as soon as the request is served by the server. Serverless application aka FaaS (Function as a Service) is another example. Serverless instances are created automatically based on some triggers/events.
Events could be of different types like when an order is placed then a Serverless app would be created to handle fulfillment, AWS provides many ways to trigger a function call on different types of events like whenever some item is changed in DynamoDB then emit an event, on the addition of new item in SQS queue triggers a function, run a function at given time.
Once an event is handled by the function than instance can be terminated immediately or can be reused up to some time for example 10 minutes. Generally, developers do not have control over the serverless instance termination, like in HTTP request handling where a new process can be terminated once client's request is served.
The application which has only one application instance can provide the Prometheus scrape end-point without any problem as this can store data in the same application instance and share across multiple threads.
Application those are created on-demand has a problem as data would be scattered across multiple instances and as we discussed instance would be destroyed at some point in time, which means data would be lost as well, otherwise, we would need some sort of aggregators that would aggregate data from these instances and store it in some common memory area. There're many ways to solve the second problem like Prometheus Pushgateway, Prometheus exporter.
Prometheus With Pushgateway

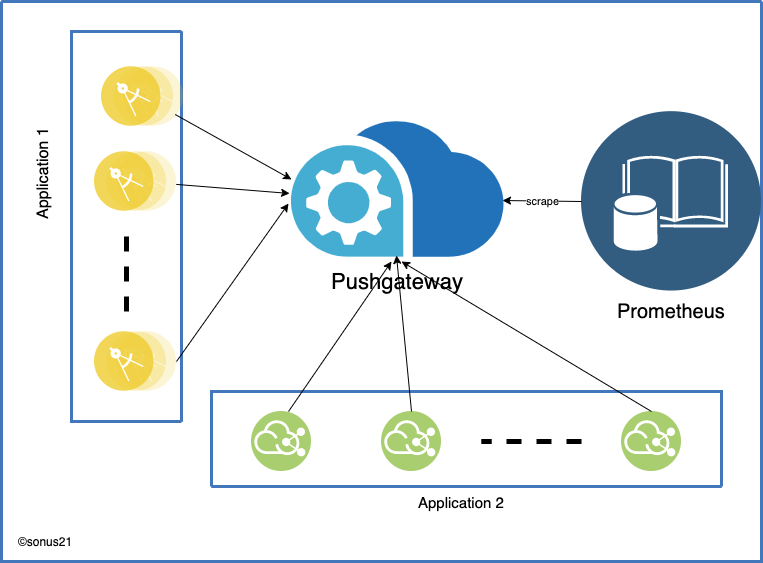
In the above figure, there're two types of applications Application 1 and Application 2. Either of them could be a serverless application or some Multiprocess web-apps.
Pushgatway stores data in its internal data store and that's scrapped by Prometheus as configured. It solves the problem of application data storage but this brings another problem single point of failure if only one instance of Pushgatway is configured.
By any chance, Pushgatway goes into a bad state like hardware failure, network issue from client to push gateway or it's unable to handle high throughput then all metrics would be lost. Pushgateway should be considered last resort in the deployment as explained in the doc
We only recommend using Pushgateway in certain limited cases. There are several pitfalls when blindly using the Pushgateway instead of Prometheus's usual pull model for general metrics collection:
- When monitoring multiple instances through a single Pushgateway, the Pushgateway becomes both a single point of failure and a potential bottleneck.
- You lose Prometheus's automatic instance health monitoring via the
upmetric (generated on every scrape). - The Pushgateway never forgets series pushed to it and will expose them to Prometheus forever unless those series are manually deleted via the Pushgateway's API.
Reference: https://prometheus.io/docs/practices/pushing/
Basically this should be used for serverless like application where new instances are launched and destroyed on demand, also applications those handles batch job.
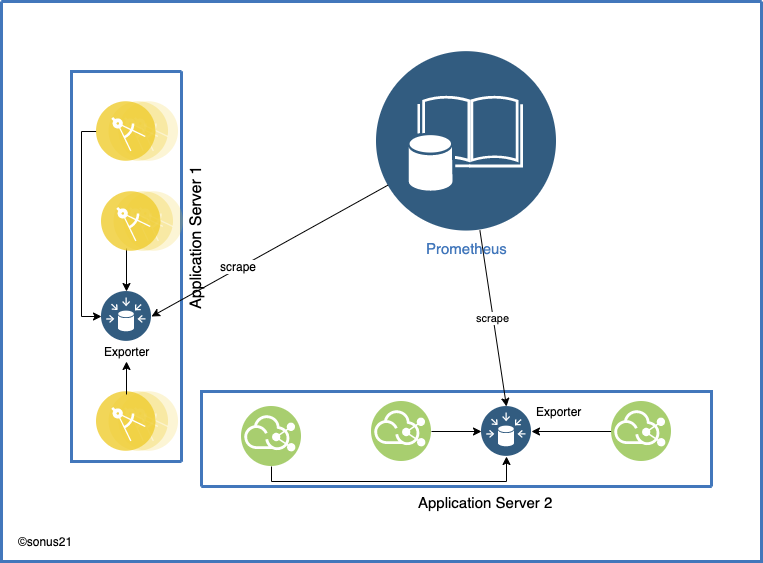
Due to the above limitations, we should consider using other alternatives like Node exporter, StatsD exporter, Graphite Exporter. All these three exporters are deployed on the host machine along with application code and data is collected in the exporter instance.

Node Exporter
Node exporter is one of the recommended exporters as this can export host system details as well like ARP, CPU, disk utilization, Mem info, text-file. The text file is an interesting part of the exporters, as our application has to write data in the text file and this text file would be exported to Prometheus.
A text file must follow Prometheus text data formatting, application code would keep appending data in the text file and that would be exported by the exporter. To use it, set the —collector.textfile.directory flag on the Node exporter. The collector will parse all files in that directory matching the glob *.prom using the text format.
Ref: https://prometheus.io/docs/instrumenting/exposition_formats/#text-format-example
# HELP http_requests_total The total number of HTTP requests.
# TYPE http_requests_total counter
http_requests_total{method="post",code="200"} 1027 1395066363000
http_requests_total{method="post",code="400"} 3 1395066363000
# Escaping in label values:
msdos_file_access_time_seconds{path="C:\\DIR\\FILE.TXT",error="Cannot find file:\n\"FILE.TXT\""} 1.458255915e9
# Minimalistic line:
metric_without_timestamp_and_labels 12.47
# A weird metric from before the epoch:
something_weird{problem="division by zero"} +Inf -3982045
# A histogram, which has a pretty complex representation in the text format:
# HELP http_request_duration_seconds A histogram of the request duration.
# TYPE http_request_duration_seconds histogram
http_request_duration_seconds_bucket{le="0.05"} 24054
http_request_duration_seconds_bucket{le="0.1"} 33444
http_request_duration_seconds_bucket{le="0.2"} 100392
http_request_duration_seconds_bucket{le="0.5"} 129389
http_request_duration_seconds_bucket{le="1"} 133988
http_request_duration_seconds_bucket{le="+Inf"} 144320
http_request_duration_seconds_sum 53423
http_request_duration_seconds_count 144320
# Finally a summary, which has a complex representation, too:
# HELP rpc_duration_seconds A summary of the RPC duration in seconds.
# TYPE rpc_duration_seconds summary
rpc_duration_seconds{quantile="0.01"} 3102
rpc_duration_seconds{quantile="0.05"} 3272
rpc_duration_seconds{quantile="0.5"} 4773
rpc_duration_seconds{quantile="0.9"} 9001
rpc_duration_seconds{quantile="0.99"} 76656
rpc_duration_seconds_sum 1.7560473e+07
rpc_duration_seconds_count 2693
StatsD Exporter
StatsD exporter speaks StatsD protocol, and an application can talk to StatsD exporter using TCP/UDP or UNIX datagram socket. StatsD can't understand any other data than its predefined format, therefore the application must send data in StatsD format. There're many client libraries that can send data in StatsD format.
StatsD data format
xxxxxxxxxx
<metric_name>:<metric_value>|<metric_type>|<sampling_rate>
Some sample data might look like as
xxxxxxxxxx
# login users count sampled at 50% sampling rate login.users:10|c|.5
I would suggest using some library to communicate with StatsD exporter unless you're willing to take risks.
Graphite Exporter
Graphite exporter is very similar to StatsD exporter but it speaks Graphite Plaint Text protocol. Any application's memory usage would keep increasing if it's not scraped for some reason, which can lead to OOM (Out of Memory) exception.
To avoid OOM metrics will be garbage collected five minutes after they are last pushed to the exporter nevertheless, this behavior is configurable with the —graphite.sample-expiry flag.
In Graphite plain text protocol data is described using: <metric path> <metric value> <metric timestamp>
Graphite also supports tagging/labeling of metrics as well, that can be archived by adding tags to a metric path as:
disk.used;datacenter=dc1;rack=a1;server=web01
In that example, the series name is disk.used and the tags are datacenter =dc1 , rack=a1, and server=web01
If you found this post helpful please share, like, and leave a comment!
Further Reading
Set Up and Integrate Prometheus With Grafana for Monitoring
Go Microservices, Part 15: Monitoring With Prometheus
Monitoring Using Spring Boot 2.0, Prometheus, and Grafana (Part 2 — Exposing Metrics)
Opinions expressed by DZone contributors are their own.

Comments