Profiling Big Datasets With Apache Spark and Deequ
Struggling to maintain large dataset quality or ensure reliable data attributes in your analyses? Integrating Deequ with Spark might be the solution you need.
Join the DZone community and get the full member experience.
Join For FreeIn today's data-driven environment, mastering the profiling of large datasets with Apache Spark and Deequ is crucial for any professional dealing with data analysis, SEO optimization, or similar fields requiring a deep dive into digital content.
Apache Spark offers the computational power necessary for handling vast amounts of data, while Deequ provides a layer for quality assurance, setting benchmarks for what could be termed 'unit tests for data'. This combination ensures that business users gain confidence in their data's integrity for analysis and reporting purposes.
Have you ever encountered challenges in maintaining the quality of large datasets or found it difficult to ensure the reliability of data attributes used in your analyses? If so, integrating Deequ with Spark could be the solution you're looking for. This article is designed to guide you through the process, from installation to practical application, with a focus on enhancing your workflow and outcomes. By exploring the functionalities and benefits of Deequ and Spark, you will learn how to apply these tools effectively in your data projects, ensuring that your datasets not only meet but exceed quality standards. Let's delve into how these technologies can transform your approach to data profiling and quality control.
Introduction to Data Profiling With Apache Spark and Deequ
Understanding your datasets deeply is crucial in data analytics, and this is where Apache Spark and Deequ shine. Apache Spark is renowned for its fast processing of large datasets, which makes this famous tool indispensable for data analytics. Its architecture is adept at handling vast amounts of data efficiently, which is critical for data profiling.
Deequ complements Spark by focusing on data quality. This synergy provides a robust solution for data profiling, allowing for the identification and correction of issues like missing values or inconsistencies, which are vital for accurate analysis.
What exactly makes Deequ an invaluable asset for ensuring data quality? At its core, Deequ is built to implement 'unit tests for data', a concept that might sound familiar if you have a background in software development. These tests are not for code, however; they're for your data. They allow you to set specific quality benchmarks that your datasets must meet before being deemed reliable for analysis or reporting.
Imagine you're handling customer data. With Deequ, you can easily set up checks to ensure that every customer record is complete, that email addresses follow a valid format, or that no duplicate entries exist. This level of scrutiny is what sets Deequ apart—it transforms data quality from a concept into a measurable, achievable goal.
The integration of Deequ with Apache Spark leverages Spark's scalable data processing framework to apply these quality checks across vast datasets efficiently. This combination does not merely flag issues; it provides actionable insights that guide the correction process. For instance, if Deequ detects a high number of incomplete records in a dataset, you can then investigate the cause—be it a flaw in data collection or an error in data entry—and rectify it, thus enhancing the overall quality of your data.
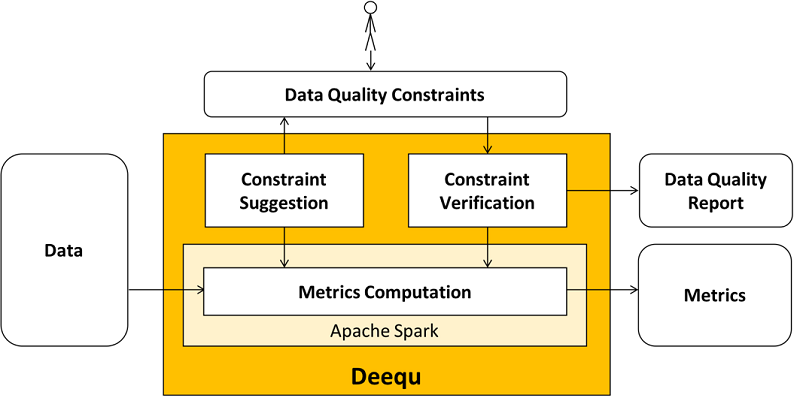
Below is a high-level diagram (Source: AWS) that illustrates the Deequ library's usage within the Apache Spark ecosystem:

Setting up Apache Spark and Deequ for Data Profiling
To begin data profiling with Apache Spark and Deequ, setting up your environment is essential. Ensure Java and Scala are installed, as they are prerequisites for running Spark, which you can verify through Spark's official documentation.
For Deequ, which works atop Spark, add the library to your build manager. If you're using Maven, it's as simple as adding the Deequ dependency to your pom.xml file. For SBT, include it in your build.sbt file, and make sure it matches your Spark version.
Python users, you're not left out. PyDeequ is your go-to for integrating Deequ's capabilities into your Python environment. Install it with pip using the following commands:
pip install pydeequAfter installation, conduct a quick test to ensure everything is running smoothly:
import pydeequ

# Simple test to verify installation
print(pydeequ.__version__)
This quick test prints the installed version of PyDeequ, confirming that your setup is ready for action. With these steps, your system is now equipped to perform robust data quality checks with Spark and Deequ, paving the way for in-depth data profiling in your upcoming projects.
Practical Guide To Profiling Data With Deequ
Once your environment is prepared with Apache Spark and Deequ, you're ready to engage in the practical side of data profiling. Let’s focus on some of the key metrics that Deequ provides for data profiling —Completeness, Uniqueness, and Correlation.
First is Completeness; this metric ensures data integrity by verifying the absence of null values in your data. Uniqueness identifies and eliminates duplicate records, ensuring data distinctiveness. Finally, Correlation quantifies the relationship between two variables, providing insights into data dependencies.
Let’s say you have a dataset from IMDb with the following structure:
root
 |-- tconst: string (nullable = true)
 |-- titleType: string (nullable = true)
 |-- primaryTitle: string (nullable = true)
 |-- originalTitle: string (nullable = true)
 |-- isAdult: integer (nullable = true)
 |-- startYear: string (nullable = true)
 |-- endYear: string (nullable = true)
 |-- runtimeMinutes: string (nullable = true)
 |-- genres: string (nullable = true)
 |-- averageRating: double (nullable = true)
 |-- numVotes: integer (nullable = true)
We'll use the following Scala script to profile the dataset. This script will apply various Deequ analyzers to compute metrics such as the size of the dataset, the completeness of the 'averageRating' column, and the uniqueness of the 'tconst' identifier.
import com.amazon.deequ.analyzers._
import com.amazon.deequ.AnalysisRunner
import org.apache.spark.sql.SparkSession

val spark = SparkSession.builder()
  .appName("Deequ Profiling Example")
  .getOrCreate()

val data = spark.read.format("csv").option("header", "true").load("path_to_imdb_dataset.csv")

val runAnalyzer: AnalyzerContext = { AnalysisRunner
  .onData(data)
  .addAnalyzer(Size())
  .addAnalyzer(Completeness("averageRating"))
  .addAnalyzer(Uniqueness("tconst"))
  .addAnalyzer(Mean("averageRating"))
  .addAnalyzer(StandardDeviation("averageRating"))
  .addAnalyzer(Compliance("top rating", "averageRating >= 7.0"))
  .addAnalyzer(Correlation("numVotes", "averageRating"))
  .addAnalyzer(Distinctness("tconst"))
  .addAnalyzer(Maximum("averageRating"))
  .addAnalyzer(Minimum("averageRating"))
  .run()
}

val metricsResult = successMetricsAsDataFrame(spark, runAnalyzer)
metricsResult.show(false)
Executing this script provides a DataFrame output, which reveals several insights about our data:

From the output, we observe:
- The dataset has 7,339,583 rows.
- The
tconstcolumn's complete distinctness and uniqueness at 1.0 indicates every value in the column is unique. - The
averageRatingspans from a minimum of 1 to a maximum of 10, averaging at 6.88 with a standard deviation of 1.39, highlighting the data's rating variation. - A completeness score of 0.148 for the
averageRatingcolumn reveals that only about 15% of the dataset's records have a specified average rating. - Analyzing the relationship between
numVotesandaverageRatingthrough the Pearson correlation coefficient, which stands at 0.01, indicates an absence of correlation between these two variables, aligning with expectations.
These metrics equip us with insights to navigate your dataset's intricacies, supporting informed decisions and strategic planning in data management.
Advanced Applications and Strategies for Data Quality Assurance
Data quality assurance is an ongoing process, vital for any data-driven operation. With tools like Deequ, you can implement strategies that not only detect issues but also prevent them. By employing data profiling on incremental data loads, we can detect anomalies and maintain consistency over time. For instance, utilizing Deequ’s AnalysisRunner, we can observe historical trends and set up checks that capture deviations from expected patterns.
For example, if the usual output of your ETL jobs is around 7 million records, a sudden increase or decrease in this count could be a telltale sign of underlying issues. It’s crucial to investigate such deviations as they may indicate problems with data extraction or loading processes. Utilizing Deequ’s Check function allows you to verify compliance with predefined conditions, such as expected record counts, to flag these issues automatically.
Attribute uniqueness, crucial in data integrity, also requires constant vigilance. Imagine discovering a change in the uniqueness score of a customer ID attribute, which should be unwaveringly unique. This anomaly could indicate duplicate records or data breaches. Timely detection through profiling using Deequ's Uniqueness metric will help you maintain the trustworthiness of your data.
Historical consistency is another pillar of quality assurance. Should the 'averageRating' column, which historically fluctuates between 1 and 10, suddenly exhibit values outside this range, which raises questions. Is this a data input error or an actual shift in user behavior? Profiling with Deequ helps you discern the difference and take appropriate measures. The AnalysisRunner can be configured to track the historical distribution of 'averageRating' and alert you to any anomalies.
Business Use Case for Anomaly Detection Using Aggregated Metric From Deequ
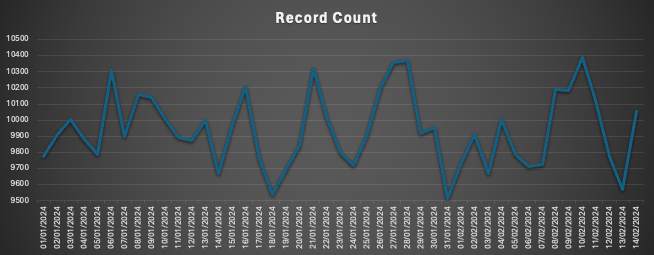
Consider a business use case where a process is crawling the pages of websites and it requires a mechanism to identify if the crawling process is working as expected or not. In order to place an anomaly detection in this process, we can use the Deequ library to identify record counts at particular intervals and use it for advanced anomaly detection techniques. For e.g., a crawl is identifying 9500 to 10500 pages daily on a website over a period of 2 months. In this case, if the crawl range goes above or below this range we may like to raise an alert to the team. The diagram below displays the daily calculated record count of pages seen on the website.

Using basic statistical techniques like rate of change (records change on a day-to-day basis), one can see that the changes always oscillate around zero as shown in the image below.

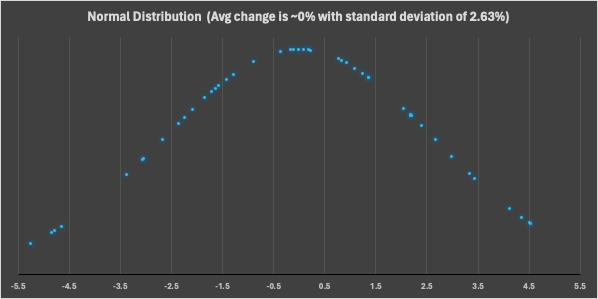
The diagram below displays the normal distribution of the rate of change and based on the shape of the bell curve it is evident that the anticipated change for this data point is around 0% with a standard deviation of 2.63%.

This indicates that for this website the page addition/deletion follows a range of around -5.26% to +5.25% with 90% confidence. Based on this indicator, one can set up a rule on the page record count to raise an alert, if the change range does not follow this guideline.
This is a basic example of using the statistical method over data to identify anomalies over aggregated numbers. Based on the historic data availability and factors such as seasonality etc., methodology such as Holt-Winters Forecasting can be used for efficient anomaly detection.
The fusion of Apache Spark and Deequ emerges as a powerful combo that will help you elevate the integrity and reliability of your datasets. Through the practical applications and strategies demonstrated above, we've seen how Deequ not only identifies but prevents anomalies, ensuring the consistency and accuracy of your precious data.
So, if you want to unlock the full potential of your data, I advise you to leverage the power of Spark and Deequ. With this toolset, you will safeguard your data's quality and dramatically enhance your decision-making processes, and your data-driven insights will be both robust and reliable.
Opinions expressed by DZone contributors are their own.

Comments