Power BI vs Tableau: Comparison Between Top Two BI Tools
In tis article, compare two BI tools, Power BI and Tableau.
Join the DZone community and get the full member experience.
Join For FreeThese statistics represent the universal interest and the importance of business intelligence software across the world.
The worldwide market size for business intelligence and analytics software applications is forecast to reach 16.5 billion in 2023
[Source: Statista]
The business intelligence software segment is expected to show a revenue growth of 15.3% in 2021. [Source: Statista]
Reporting, dashboards, data integration, data warehousing, and data preparation are top technologies and initiatives strategic to BI in 2020.
The greater the uncertainty in an industry, the more likely their executive and C-suite leaders are using BI to search for greater stability.
BI tools are more commonly used by R&D, Business Intelligence Competency Centers (BICC), Marketing & Sales, and IT in 2020.
[Source: Dresner Advisory Associates’ 11th edition of popular Business Intelligence Market Study]
Business Intelligence tools are must-have tools for businesses regardless of size or industry they operate in. Data holds huge value for today’s businesses to design new strategies, uncover potential insights, and streamlines the decision-making process.
Do You Use a Business Intelligence Tool?
If yes, this article offers detailed information and if you are still waiting to pick one BI tool for your business, this article is for you. We will be talking about two powerful BI tools — Power BI and Tableau and the differences between them.
Power BI vs Tableau — Most Discussed Comparison Of Top Business Intelligence Tools
Both of these tools possess a huge user base and a wide community of consultants, developers, and analysts. Both tools are enjoying dominant positions in business analytics and data science space. But chalking out important differences help in the selection of suitable tool according to your business needs.
What Is Tableau?
Tableau is an interactive data visualization tool from Tableau Software, a data visualization company headquartered in the United States. It is founded in 2003 by Pat Hanrahan, Christian Chabot, and Chris Stolte. It is acquired by Salesforce in 2019.
Gartner listed Tableau as a leader for the 8th consecutive year in their 2020 Magic Quadrant for Analytics and Business Intelligence platforms.
What Is Power BI?
For 13 consecutive years, Gartner has recognized Microsoft as a Magic Quadrant Leader in analytics and business intelligence platforms.
Power BI is a business intelligence and data visualization tool from Microsoft. More popular as a self-service BI tool, the Power BI tool allows users to create reports and dashboards through an intuitive interface.
Let’s go beyond definition.
What Makes Tableau Popular BI Tool? Here’s An Overview Of Tableau:
Ease of use and powerful analytics — yes, these two features of Tableau make it one of the widely-used BI tools. Tableau is very user-friendly and offers self-service BI capabilities that enable users to extract insights from data through quick and interactive visualizations.
The dashboards created with Tableau are very easy-to-understand, attractive, and interactive. Here’s a recent example of Tableau Dashboard.
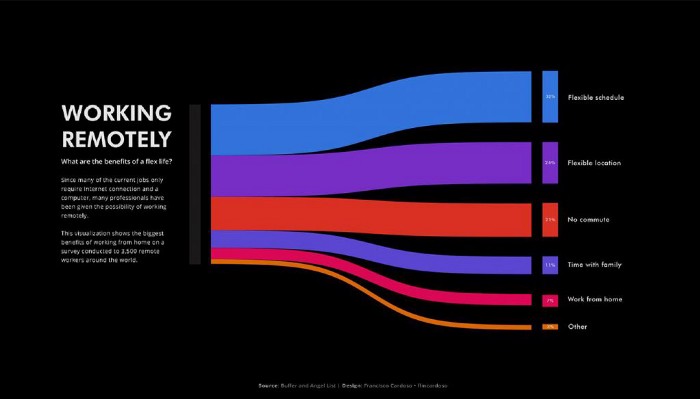
Highlights Of Tableau:
- End-to-end analytics platform
- Easy-to-use, self-service BI tool
- Quick, interactive, and intuitive tool
- A fastest-growing data visualization tool
- Capable to handle a vast amount of data
- Hassle-free enterprise-level scalability
- Supports various data sources
- Real-time analytics and results
- Mobile-friendly dashboards and responsive design
- Can be integrated with scripting languages
Top Companies Using Tableau:
- Apple
- Lenovo
- Cisco Systems
- Box
- GoDaddy
- Seagate
- Wells Fargo
- JP Morgan Chase
- Verizon
- Honeywell
- Lufthansa
- Walmart
- Deloitte
- Nissan
Thousands of small businesses as well as world-famous enterprises are using Tableau in their environment to understand, manage, prepare, and use their data.
Now moving to Power BI, one of the widely-implemented business intelligence tools from Microsoft.
A Quick Overview Of PowerBI: A Suite Of Business Intelligence And Data Visualization Services
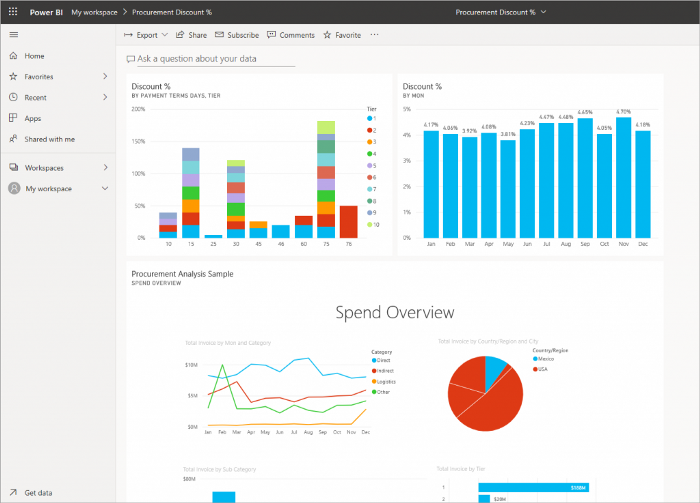
Microsoft’s Power BI is a set of BI, reporting, and data visualization products and services. It is equipped with modern features and real-time analytics capabilities to help convert raw data into interactive and visually-appealing dashboards.
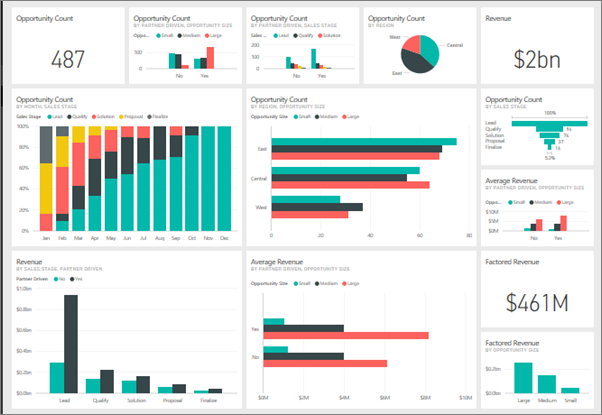
Power BI Dashboard looks like this:
Why Power BI?
- Easy set-up, easy-to-use
- Rich, customizable, interactive dashboards
- Real-time analytics and visuals
- Easy collaboration and sharing of reports
- Self-service and enterprise data analytics
- 360-degree view of data, natural-language query
- Efficient, accurate, And cost-effective BI tool
Top Companies Using Power BI:
- Metro Bank
- Conde Nast
- Aston Martin
- Rolls Royce
- Heathrow
- Hewlett Packard
- Adobe
- Kraft Heinz
- GE Healthcare
- Rockwell Automation
Power BI vs Tableau: Here Are Major Differences Between Two Tools
We will be evaluating differences based on several factors. These factors are important while choosing a BI tool.
Data Visualization:
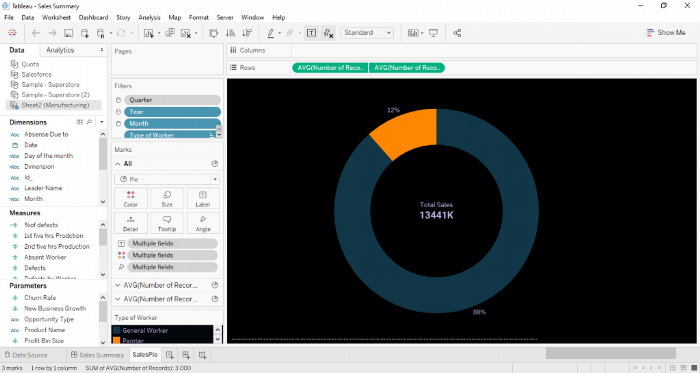
Both these tools have their own strengths when it comes to data representation. Tableau provides more depth of data, allowing users to drill down data with just drag-and-drop functionality. Tableau Reporting aims to simplify visualizations so that data analysts can find the answers by adjusting, comparing, and analyzing the data. It is more like a visualization tool rather than a manipulation of data, unlike Power BI. You can switch between visualizations easily in Tableau and it is more like query-based.
Power BI focuses more on reporting, predictive modeling, and manipulation of data. The drag-and-drop features of Power BI help even novice users to access Power BI’s powerful data analytics features. Real-time data access, easy-to-start interface, best user experience, and the correlation between different data sources — these are just a few things that make Power BI a very handy BI tool designed for both inexperienced and experts.
Products:
Both these platforms have launched various products for the data analytics and business intelligence market. Here is the list of each platform’s services and products:
Power BI’s Products and Services:
Power BI is a part of the Microsoft Business Intelligence MSBI Suite and offers a wide range of products and services.
- Power BI Desktop: free visualization and reporting tool
- Power BI Pro and Power BI Premium: Cloud-based business analytics and data visualization service (paid)
- Power BI Mobile: Monitor and access Power BI dashboards anytime, anywhere
- Power BI Report Server: On-premise enterprise reporting server, available in two licenses — Power BI Premium and SQL Server Enterprise Edition
What Does Tableau Offer?
- Tableau Server: Enterprise-level online platform to manage data and data sources
- Tableau Online: Cloud-based analytics platform makes sharing and collaboration easy
- Tableau Desktop: Self-service business analytics and data visualization tool
- Tableau Prep: A visual and direct interface to make data preparing easy and advanced
- Tableau Reader: A free desktop application to view and interact with data visualizations
- Tableau Mobile: Access data wherever, whenever with Tableau Mobile Apps
Power BI vs Tableau Cost Comparison:
If we compare these tools in terms of cost, Power BI is cost-effective than Tableau. It is affordable, effective for business users, especially those who are already using Microsoft products. Even if we select a monthly subscription or scalable premium service, Power BI is a low-cost BI tool compared to Tableau. However, the pricing is subjective and based on users, scalability, and maintenance.
With Tableau, the more you pay, the more you can access it. Tableau is relatively expensive. Regardless of pricing factor, Tableau’s data visualization capability, data-interpretation, and integration with scripting languages like R and Python making it a favorite among data analysts.
Power BI And Tableau Performance Comparison:
Both tools use different approaches to data visualization. Tableau is a great choice for data discovery and ad-hoc analysis. It is a fully integrated platform and works great with larger datasets.
According to its official source,
Total Economic Impact Study commissioned by Tableau and conducted by Forrester Consulting reported that Tableau’s customers experienced a 587% ROI. Tableau is flexible, faster, scalable, and offers better governance of data.
Tableau vs Power BI Data Visualization
SPEC INDIA’s Live Tableau Demo:
- Hospitality Analysis Dashboard representing data of various hotels of two countries — the US and India.
- Sales Summary Dashboard allows sales executives to track quarter to date (QTD) sales performance.
On the other hand, Power BI help establish data-driven culture by offering real-time and self-service analytics that doesn’t even require prior knowledge and experience. Microsoft is continuously enhancing its Power Platform, positioning itself as a leader in business intelligence and analytics space. From business perspectives, Power BI enjoys a dominant position in the market. Power BI is a full-fledged BI tool and suitable for small, medium, and large enterprises.
Organizations saw a three-year 366% return on investment with business intelligence through Microsoft Power BI. [Source: microsoft.com]
SPEC INDIA’s Live Power BI Demo:
- Mall Analysis Dashboard providing a comprehensive report of all the brand stores and outlets in the mall.
- Predictive Market Basket Analysis for leading supermarket chain.
Integrations:
Through the “Get Data” button in Power BI, you can connect to a wide number of data sources, for example:
- Azure Analysis Service
- CSV
- Salesforce
- Oracle
- Excel
- MySQL
- SharePoint Lists
- Azure Analysis Services
- Cloud Services
- Real-time data streaming
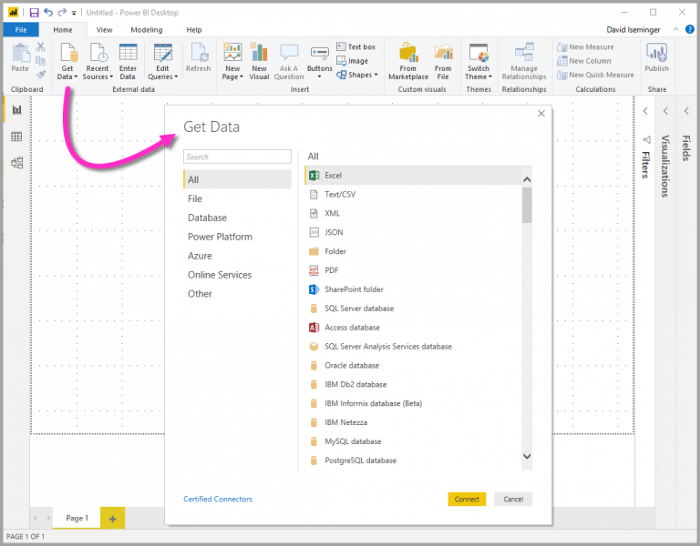
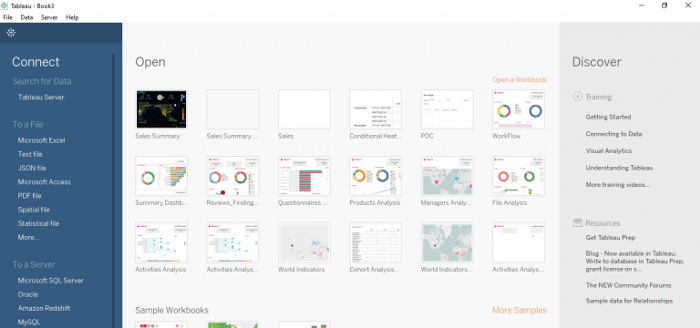
Tableau offers connectivity to comparatively a huge number of data sources, for example, Microsoft Excel, PDF File, Google Analytics, Databases, SAP, and so on. The list goes on. Tableau’s connection is a little complicated as you need to identify why and what data you require to make the connection. It helps in a better understanding of data.
Power BI vs Tableau: A Quick Comparison Summary
| Parameters | Power BI | Tableau |
| Parent Company | Microsoft | Salesforce |
| Establishment Year | 2013 | 2003 |
| Learning Curve | Very easy | Little steep |
| Pricing | Cost-effective | Costly |
| Usability | Small, medium, and large enterprises | Especially large enterprises |
| UI | Familiar to Microsoft products | Intuitive and easy-to-use |
| Security | Raw-level security and roles restriction | Offers raw-level security and set up filters |
| Underlying language | DAX (Data Analysis Expression) | MDX (Multidimensional Expressions) |
| Performance | Rich in data visualization, integration, and manipulation | Hypothetical visualization, ad-hoc analysis, capable to handle a huge volume of datasets |
| Installation | Easy to set up and start | Easy and quick |
As both have their limitations and advantages, the selection of one tool primarily depends on business requirements, a number of users, and resources.
Power BI vs Tableau FAQS
Which one is better — Power BI vs Tableau?
Both these tools have their own set of features and strengths for data visualization and business intelligence. Tableau is capable of handling large datasets whereas Power BI is more like Microsoft’s tool and known for its ease of use and user-friendly UIs.
What Are The Advantages of Power BI Over Tableau?
Real-time streaming datasets can be created directly in Power BI. It is also better at handling complex relationships between tables and data sources.
It is faster and gives quick insights.
What Are The Advantages Of Tableau Over Power BI?
Tableau strives to offer statistical analysis and specific answers while Power BI is more like reporting and visualization tools along with advanced capabilities.
Is Power BI difficult to learn?
No, it is not dif0ficult to learn provided you are familiar with Microsoft products and data visualization terms.
Is Tableau hard to learn?
No, Tableau is not difficult to learn. Analytical skills and knowledge of data visualization can help learn it faster.
Does Tableau use Python?
Yes, you can use Python with Tableau for powerful and in-depth data analytics.
What are the disadvantages of using Tableau?
The main cons of using Tableau are high cost and inflexible pricing structure. Embedment issues are also there.
Which Is Better, Power BI vs Tableau? What Should You Choose and When?
It depends on the user. Yes, while choosing these tools, along with the above-mentioned parameters, you have to think who will be using these tools. Power BI can be used by even a non-experienced person and offers insights and data analytics using drag-and-drop features. Tableau does provide the same but some prior knowledge of data visualization and big data helps analysts to better leverage it.
Power BI is suitable for small teams with limited resources, and Tableau, on the other side, is known for its bulk data handling capacity and suitable for medium and large enterprises.
Both are leaders in the business intelligence space.
Using data to drive growth — is now a vision of every company be it small, medium, or larger enterprise.
Have you implemented any BI tool?
Share your experience with us!
Note: We always insist that the choice of BI tool is subjective and depends on many factors such as need, budget, number of users, and organizational factors. This article is written to help you understand these tools in detail so that you can choose better.
Published at DZone with permission of Ankit Kumar. See the original article here.
Opinions expressed by DZone contributors are their own.

Comments