Performance Caching in a Snowflake Data Warehouse
See how a data warehouse built for the cloud maximizes query performance.
Join the DZone community and get the full member experience.
Join For FreeLike any modern database, Snowflake uses various levels of caching to maximize query performance and reduce disk I/O and machine load. This article provides an overview of the techniques used by Snowflake, the data warehouse built for the cloud.
System Architecture
Before starting, it’s worth considering the underlying Snowflake architecture and explaining when Snowflake caches data. The diagram below illustrates the overall architecture, which consists of three layers:
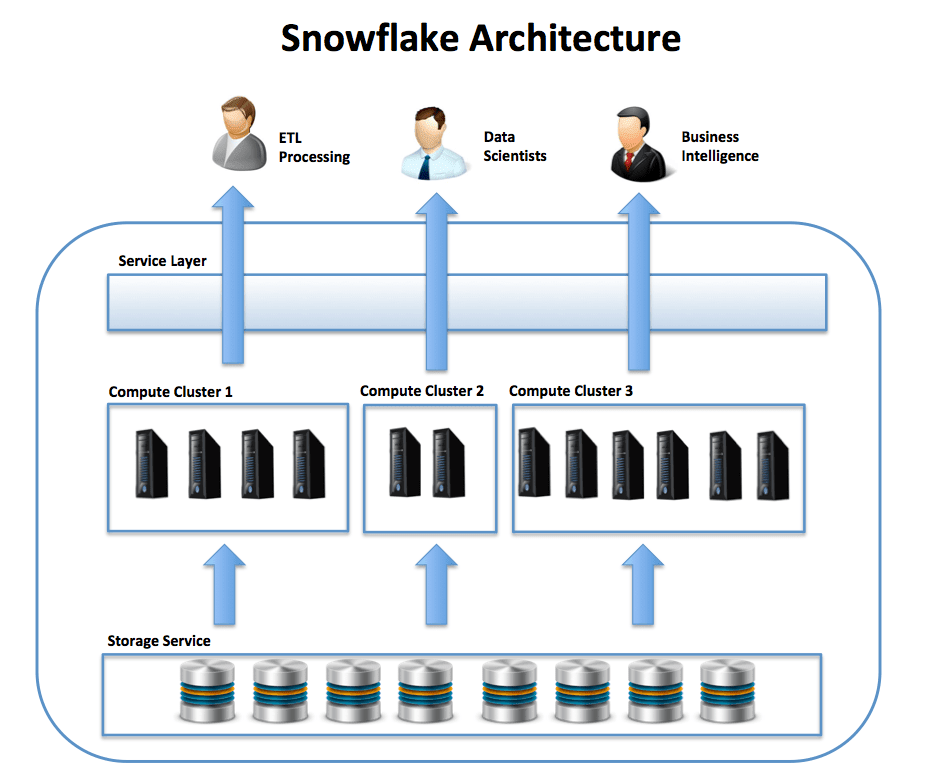
- The Service Layer accepts SQL requests from users, coordinates queries, and manages transactions and results. Logically, this can be assumed to hold the result cache, a cached copy of the results of every query executed.
- The Compute Layer actually does the heavy lifting. This is where the actual SQL is executed across the nodes of a Virtual Data Warehouse. This layer holds a cache of data queried, and is often referred to as Local Disk I/O, although in reality this is implemented using SSD storage. All data in the compute layer is temporary and only held as long as the virtual warehouse is active.
- The Storage Layer provides long-term storage of results. This is often referred to as Remote Disk and is currently implemented on either Amazon S3 or Microsoft Blob storage.
Snowflake Caching Layers
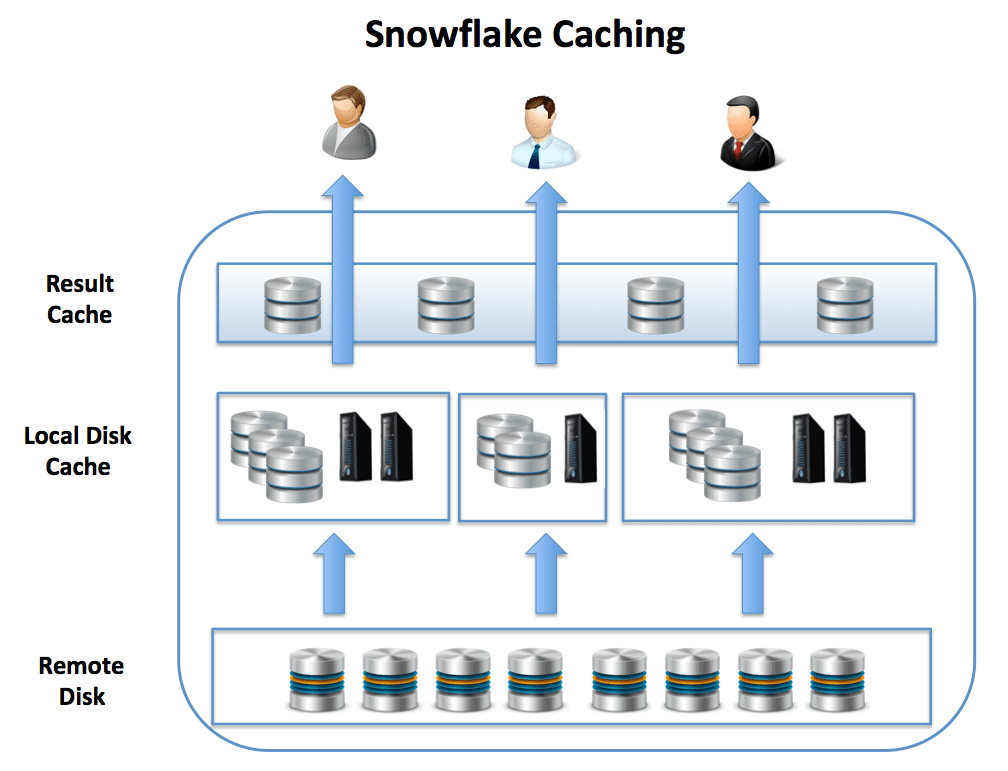
The diagram below illustrates the levels at which data and results are cached for subsequent use:
- The Result Cache holds the results of every query executed in the past 24 hours. These are available across virtual warehouses, so query results returned to one user are available to every user in the system.
- The Local Disk Cache caches data used in queries. Whenever data is needed for a given query, it's retrieved from the Remote Disk storage, and cached for subsequent queries here.
- The Remote Disk holds the long-term storage. This level is responsible for data resilience, which in the case of Amazon Web Services, means 99.999999999% durability, even in the event of an entire data center failure.
Benchmark Testing Setup
Every Snowflake database is delivered with a pre-built and populated set of Transaction Processing Council (TPC) benchmark tables. To test the result of caching, I set up a series of test queries against a small subset of the data, which is illustrated below.
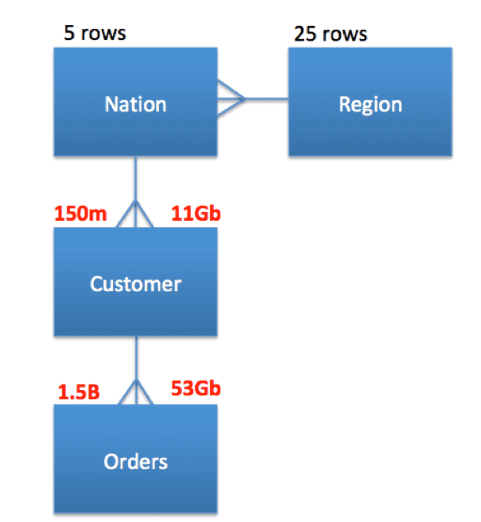
All the queries were executed on a MEDIUM sized cluster (8 nodes) and joined the tables. The tables were queried exactly as is, without any performance tuning.
The following query was executed multiple times, and the elapsed time and query plan were recorded each time.
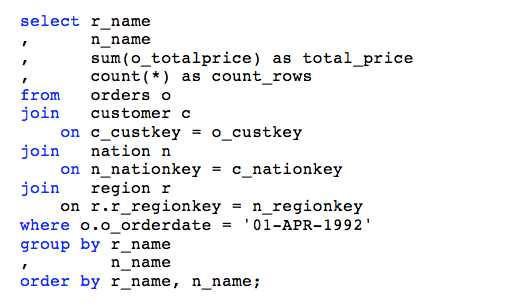
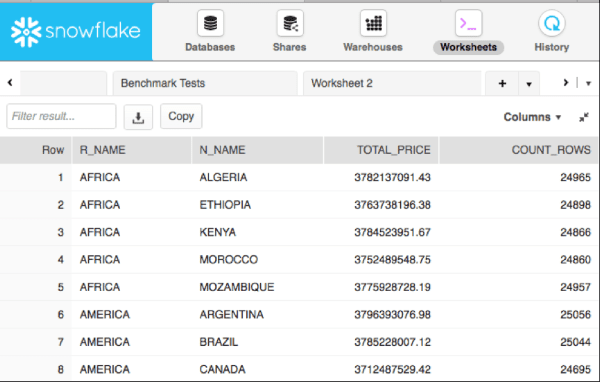
The screenshot below illustrates the results of the query which summarise the data by Region and Country. In total, the SQL queried, summarized, and counted 1.5 billion rows of data. The screenshot shows the first eight lines returned.
Test Sequence
The test sequence was as follows:
- Run from cold: Starting a new virtual warehouse (with no local disk caching), and executing the query.
- Run from warm: Disabling the result caching and repeating the query. This made use of the local disk caching.
- Run from hot: Again, repeated the query, but with the result caching switched on.
Each query included over 60Gb of raw data, although as Snowflake was able to automatically compress the data, the actual data transfers were around 12Gb. As Snowflake is a columnar data warehouse, it automatically returns the columns needed rather then the entire row to maximize query performance.
Run From Cold
This query returned in around 20 seconds and demonstrates it scanned around 12Gb of compressed data, with 0% from the local disk cache. This means it had no benefit from disk caching.
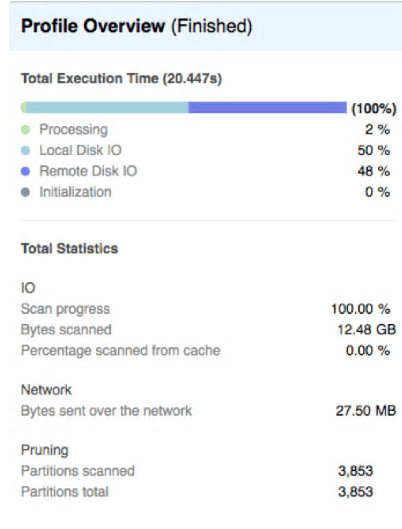
The bar chart above demonstrates around 50% of the time was spent on local or remote disk I/O, and only 2% on actually processing the data. Clearly any design changes we can do to reduce the disk I/O will help this query.
The results also demonstrate the queries were unable to perform any partition pruning which might improve query performance. We’ll cover the effect of partition pruning and clustering in the next article.
Run From Warm
This query was executed immediately after, but with the result cache disabled, and it completed in 1.2 seconds – around 16 times faster. In this case, the Local Disk cache (which is actually SSD on Amazon Web Services) was used to return results, and disk I/O is no longer a concern.
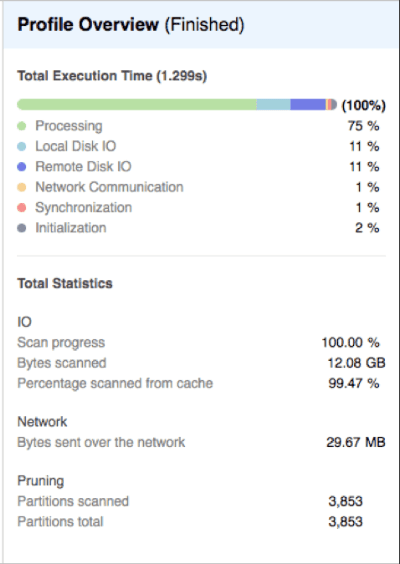
In the above case, the disk I/O has been reduced to around 11% of the total elapsed time, and 99% of the data came from the (local disk) cache. While querying 1.5 billion rows, this is clearly an excellent result.
Run From Hot
This query returned results in milliseconds and involved re-executing the query, but with this time, the result cache enabled. Normally, this is the default situation, but it was disabled for testing purposes.

The above profile indicates the entire query was served directly from the result cache (taking around 2 milliseconds). Although not immediately obvious, many dashboard applications involve repeatedly refreshing a series of screens and dashboards by re-executing the SQL. In these cases, the results are immediately returned in milliseconds.
Although more information is available in the Snowflake Documentation, a series of tests demonstrated the result cache will be reused unless the underlying data (or SQL query) has changed. As a series of additional tests demonstrated inserts, updates and deletes which don't affect the underlying data are ignored, and the result cache is used, provided data in the micro-partitions remains unchanged.
Finally, results are normally retained for 24 hours, although the clock is reset every time the query is re-executed, up to a limit of 30 days, after which results query the remote disk.
Summary
The sequence of tests was designed purely to illustrate the effect of data caching on Snowflake. The tests included:-
- Raw Data: Including over 1.5 billion rows of TPC generated data, a total of over 60Gb of raw data
- Initial Query: Took 20 seconds to complete, and ran entirely from the remote disk. Quite impressive.
- Second Query: Was 16 times faster at 1.2 seconds and used the Local Disk (SSD) cache.
- Result Set Query: Returned results in 130 milliseconds from the result cache (intentionally disabled on the prior query).
To put the above results in context, I repeatedly ran the same query on Oracle 11g production database server for a tier one investment bank and it took over 22 minutes to complete.
Finally, unlike Oracle where additional care and effort must be made to ensure correct partitioning, indexing, stats gathering and data compression, Snowflake caching is entirely automatic and available by default. Absolutely no effort was made to tune either the queries or the underlying design, although there are options available, which I'll discuss in the next article. Sign up below for further details.
Further Reading
Thank you for reading this. If you found this article interesting and would like to know more, you can read more about Snowflake, and Data Warehousing at www.analytics.today.
One of the most popular articles I’ve written describes my experience as an Oracle warehouse architect and compares this to how Snowflake would handle the problems I encountered. You can read more at The Ideal Data Warehouse Architecture.
Published at DZone with permission of John Ryan, DZone MVB. See the original article here.
Opinions expressed by DZone contributors are their own.

Comments