Pandas Dataframe Functions
Learn the basics of Pandas' Dataframe.
Join the DZone community and get the full member experience.
Join For FreePandas is a Python library that allows users to parse, clean, and visually represent data quickly and efficiently. Here, I will share some useful Dataframe functions that will help you analyze a data set.
First, you have to import the library. Conventionally, we use the alias, "pd," to refer to Pandas.
import pandas as pd # data processing, CSV file I/O (e.g. pd.read_csv)The data, which is used in the example code, is taken from Kaggle House Prices. Specifically, I used the train.csv file. Save the file in the same folder with your code; otherwise, you have to give the path detail when reading the file.
#load data
df = pd.read_csv("train.csv")
Now that the data is loaded, we can the first and last nth number of rows in the dataframe using the head() and tail() methods, respectively.
#Just give an integer parameter as the number of rows
#Should be greater than zero.
#If you leave it blank, only first or last "5" rows will return.
df.head(10)   # First nth rows
df.tail(10)   # Last nth rows
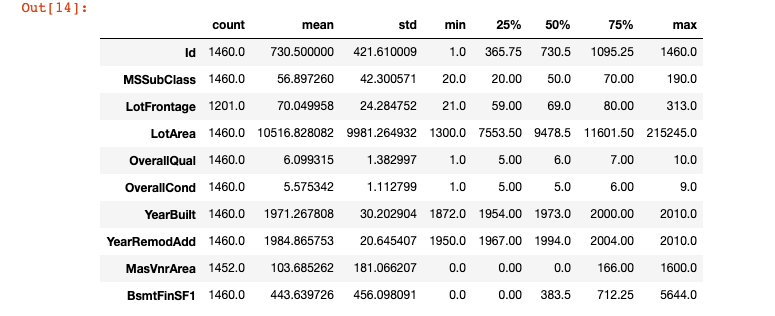
We can then use the describe() method in order to get some basic statistical information (row count, mean, standard deviation, quartiles, minimum, and maximum) about each column in our dataframe.
df.describe()
The output should look something like this:

We can also use the transpose() method or .T in order to get a transposed version of our dataframe.
df.describe().T
df.describe().transpose()
The output will look something like this (for the first ten rows).

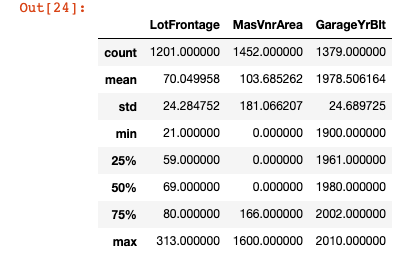
You can also describe the columns according to their column data types as below;
print(df.select_dtypes(include=['int64','float64']).describe())
print(df.select_dtypes(include=['object']).describe())
If you want to see each columns' name, number of rows, null-value, and data type, use the info() function. If you only want the data type, then use the dtypes attribute.
df.info()     # Get column name, number of rows, null, and data type.
df.dtypes     # get only data types
You can use this table later to define the numeric or non-numeric columns to handle some data manipulations on your data. This is especially useful for finding missing values.
You can use the size attribute of a Dataframe in order to get the total number of rows in each column.
# Returns size of dataframe/series which is equivalent to
#total number of elements. That is rows x columns.
df.size
Similarly, you can use the shape attribute in order to get a tuple of the row count and the column count. You can then index the tuple in order to isolate either of the values returned.
df.shape # Get a tuple of the row and column count
df.shape[0] # Get just the row count
df.shape[1] # Get just the column count
If you are working with Pandas object and can't determine if it's a Series or Dataframe object, you can use the ndim attribute. This returns the number of dimensions of the object (one if it is a Series, two if it is a Dataframe).
df.ndim       # Returns dimension of dataframe/series.
              # 1 for one dimension (series), 2 for two dimension (dataframe)
Every row has an index and an index value;
df.index          #index of rows -> Returns "RangeIndex(start=0, stop=1460, step=1)"
df.index.values   #index values of rows
df.index.tolist() #index
To get the distinct values of a column you can use the numpy library. Just as we alias Pandas to "pd", we also will follow the convention of aliasing the Numpy library as "np".
import numpy as np

print("Distinct Values for Overall Qualification&Condition")
overall_qual = np.unique(df['OverallQual'])
print(overall_qual)
You may want to get all the column names as a list and do some for loop calculations on them. This can be done by the following code;
all_columns_list = df.columns.tolist()
# get as a list of all the column names
for col in all_columns_list: print(col)
# just print the names, but you can do other jobs hereOpinions expressed by DZone contributors are their own.

Comments