Reviewing Open-Source Business Intelligence Tools
Review some open-source Business Intelligence tools that are built to simplify planning, analysis, and reporting with one software suite.
Join the DZone community and get the full member experience.
Join For FreeThis article is an overview of some top open-source Business Intelligence (BI) and reporting tools. These tools are built to simplify planning, analysis, and reporting with one software suite. The list consists mostly of BI software that doesn’t require coding to set up and configure.
Open-source BI allows businesses to install the core platform on any system in their environment for free. Hundreds of developers are continuously improving and expanding these products. You can benefit from regular updates, or even customize BI software by modifying or extending source code to meet your company’s specific needs.
Metabase
Metabase is an open-source reporting tool that offers an easy way for everyone in the company to ask questions and learn from data without knowing SQL. It has rich dashboards with auto refresh and a full screen to create, organize, and share collections of data. Experienced analysts can use SQL Mode for digging into the more complicated stuff.
With Metabase, you can create segments and metrics, filter and group your data, and explore connections between metrics. It also allows you to view data in Slack with MetaBot and schedule with Pulses.
AirBNB Superset
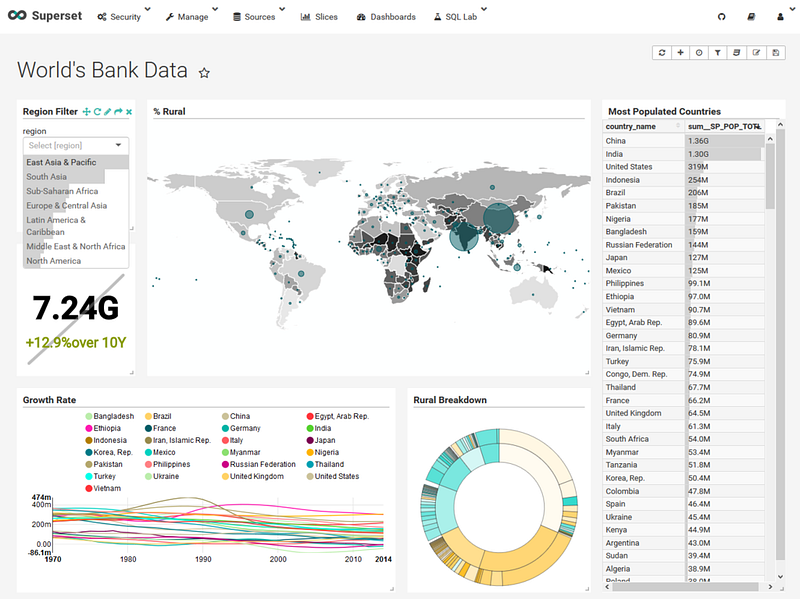
AirBNB Superset is a Business Intelligence web application to explore and visualize data. Interactive dashboards are just the starting point in going deeper with analysis — you can drill down and dice underlying datasets. SQL editor/IDE exposes a rich metadata browser and an easy workflow to work with data.
Superset works neatly with all modern SQL-speaking databases and integrates with Druid to provide interactive and fast access to real-time datasets. You can also define how data sources are shown to the user by choosing dimensions and metrics.
Pentaho BI Server 5, Mondrian, and Saiku
Pentaho’s BI platform allows users to access and discover business data using advanced analytics tools, from basic reports to predictive modeling. With this open-source BI, users can help themselves work with data using multidimensional analysis for SQL without additional IT infrastructure. This approach is called Relational OLAP or ROLAP.
You can build a powerful Business Intelligence solution based on Mondrian as your Online Analytical Processing (OLAP) engine. It brings a multidimensional query language and allows the system to respond to queries super fast even if you have large quantities of data.
Using the Saiku Analytics plugin on top of that, you can access data with an easy graphical interface. No need to copy around jar-files in shady sub-folders and edit obscure configuration files.
SpagoBI
SpagoBI is the open-source Business Intelligence solution to monitor your business data and customize your real-time analytics. It offers a wide range of analytical tools, such as reporting, OLAP, ready-to-use charts, interactive cockpits, ad-hoc reporting, and location Intelligence.
SpagoBI integrates the open-source product TOS (Talend Open Studio) to load data into the data warehouse and manage them at your convenience. You can also enrich your analysis with personal notes and comments posted by users, and share them through a collaborative workflow.
KNIME
KNIME, the Konstanz Information Miner, is an open-source Business Intelligence software that integrates various components for Machine Learning and data mining. A graphical user interface allows assembly of nodes for data preprocessing using Extraction, Transformation, and Loading (ETL) for modeling, data analysis, and visualization.
KNIME Analytics Platform framework allows you to quickly create a simple and medium complexity workflow and provide access to them through REST. It is well-suited for people who are not very familiar with programming.
ReportServer
ReportServer is an open-source BI platform that comes with a great selection of powerful tools such as pixel-perfect reporting, ad-hoc analyses, Excel and Word reporting, or multidimensional OLAP analytics.
It also offers interactive dashboards, integrations with the best reporting engines, and a wide range of flexible parameters to allow report customization. ReportServer comes with a scripting interface that allows you to tweak and adapt ReportServer to fit your exact needs.
Seal Report
Seal Report is an open-source tool that offers a complete framework for producing daily reports and dashboards from any database. It can dynamically build the SQL used to query your database, create native pivot tables, schedule your report executions and generate results, and more.
The product focuses on easy installation and report design: once set up, reports can be built and published in a minute.
RapidMiner
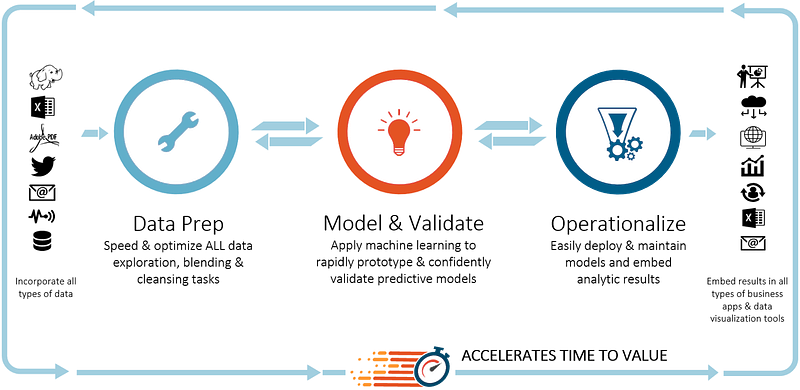
RapidMiner is a graphical user interface for the design of analytic processes that lets data scientists use machine learning to produce insights on any data. It’s provided with a sufficient number of solutions for solving various data problems.
RapidMiner Studio accelerates prototyping and validation of models to rapidly build complete predictive analytic workflows. Server provides deployment, management, and collaboration options. Radoop executes processes directly inside a Hadoop cluster.
The ELK Stack
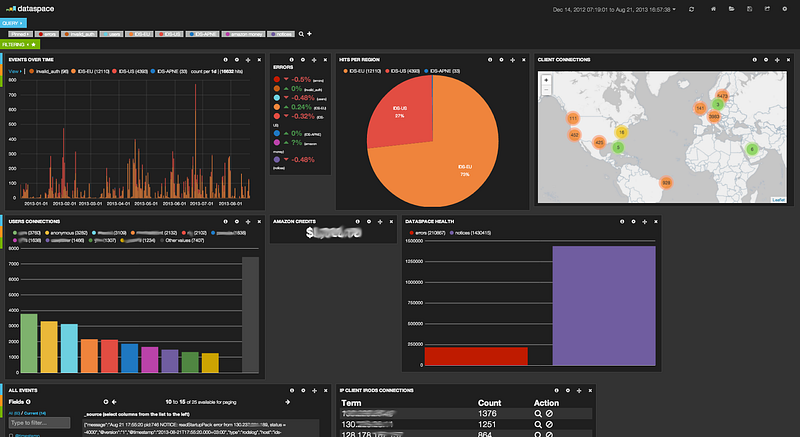
ELK, which stands for Elasticsearch, Logstash, Kibana, will give you the ability to analyze any data set by using the searching/aggregation capabilities of Elasticsearch and the visualization power of Kibana.
You can try X-Pack, a single extension that integrates handy features across the Elastic Stack: alerting, monitoring, reporting, graph exploration, and Machine Learning.
Helical Insight
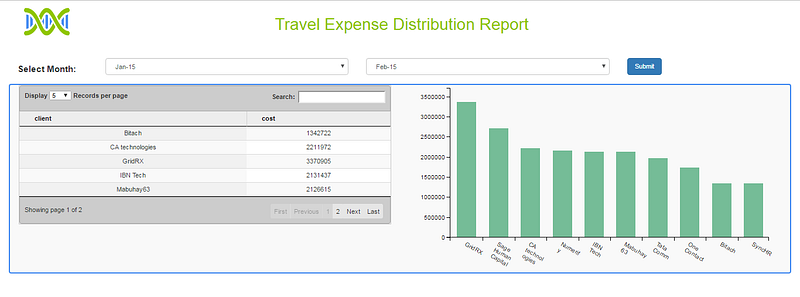
Helical Insight is an open-source, developer-friendly, API-driven Business Intelligence framework. It provides regular and out-of-the-mill features expected of a BI tool such as email scheduling, visualization, exporting, multi-tenancy, user role management, etc.
Helical Insight allows you to add functionality to either the backend or frontend without depending on the vendor. Some examples include adding a new exporting type, adding a chart in self-service that is reusable, fetching data from ETL, etc.
Jedox
Jedox is client-server-based software used to create Business Intelligence and performance management solutions for systematic data analysis. With Jedox, for example, you can unify all your Excel data and access it through MS Office, use a real-time modeling engine over big data without programming, and create and share dashboards.
Jedox was built to solve problems of every department — finance, management, sales, procurement, and marketing — to create and adjust many solutions independently, without involving IT.
Published at DZone with permission of Luba Belokon. See the original article here.
Opinions expressed by DZone contributors are their own.


Comments