O11y Guide: Finding Observability and DevEx Tranquility With Platform Engineering
This guide explores how to avoid drowning in the sea of monitoring data to instead understand how to provide insights while using only what is needed.
Join the DZone community and get the full member experience.
Join For FreeMonitoring system behavior is essential for ensuring long-term effectiveness. However, managing an end-to-end observability stack can feel like sailing stormy seas — without a clear plan, you risk blowing off course into system complexities.
By integrating observability as a first-class citizen within your platform engineering practices, you can simplify this challenge and stay on track in the ever-evolving cloud-native landscape.
Entering the world of monitoring distributed systems is a journey made up of several stages which we will cover in the rest of this article. Let's start at the beginning, where organizations attempt to navigate the observability seas and discover the complexities involved.
In the Beginning
Initially, attempts at a cohesive platform usually start with a basic monitoring strategy that simply tells you when something isn’t working. Over time the system evolves to gather more detailed insights, trying to answer the why of what went wrong. The ultimate goal is to become proactive, collecting enough data to intervene before a problem occurs.
Prevention is always better than the cure.
Navigating Platform Complexity
As the system matures, it allows us to make our applications more resilient, but it also becomes more complex. We can break down this complexity into three main areas.
The first area is adding more tools to the stack, increasing the difficulty of managing them. This struggle is well known by platform engineering teams and a constant pain for the developer teams trying to keep up with this escalating volume of tools.
The second is the volume of telemetry data, growing exponentially so that it's easy to find ourselves struggling to stay afloat. This problem is well documented in how it's not readily apparent in our monolithic application architectures but quickly raises its head in a cloud-native application architecture.
Lastly are the people, how they interact with monitoring tools where the challenge lies in ensuring the system delivers relevant information without overwhelming. As almost everyone in the organization has some level of interest in the insights provided by monitoring systems, we'll have to make sure we are tailoring uncovered insights to these users' specific needs.
An IDP Observability Journey
Using an Internal Developer Platform (IDP) as a guide during the journey into observability helps address the above challenges while mitigating issues along the way. An IDP enables the creation of clearly charted routes for developers — whether in the form of templates, containers, or APIs — that simplify the management complexity of observability tools.
For example, there can be clearly defined configurations for certain tools ensuring they work seamlessly for every developer. For a developer using the platform, it shouldn't matter which monitoring tool is being used as their primary focus is building applications and services. Everything else is abstracted away through the charted routes provided by the IDP. Should at any time in the future the monitoring tools change, the goal is a transparent transition from the developer's perspective.
Centrally managing data on the platform allows for efficient organization and simplifies the visualization of connections between data from various components of a distributed architecture. This enables a paradigm shift, moving from passively collecting monitoring data in the hope that it may one day prove useful, to a more purpose-driven approach.
Analyzing data flows that govern the architectures being monitored, identifies specific data needed for effective insights. This minimizes the collection of unnecessary data while maximizing the actionable insights that can be generated.
Lastly, the IDP serves as a crucial center for governance and centralization, especially when it comes to data visualization. It allows for the configuration of a single location where observability data can be accessed, eliminating the friction that arises when having to switch between different tools. This unified approach streamlines the user experience and makes it easier to access and act on valuable insights.
Finding Tranquility
How great would it be to work in an organization, as a platform engineer or a developer, where teams started projects with observability as a top priority?
- They would dedicate time and resources to creating a comprehensive telemetry strategy from the outset.
- They would prioritize observability just as they would prioritize testing, continuous integration, and continuous deployment from day one.
The logical starting point to achieve this is to focus on open standards and open protocols for your observability solutions. Using Cloud Native Computing Foundation (CNCF) projects to explore your options ensures that your eventual architecture is using standard components.
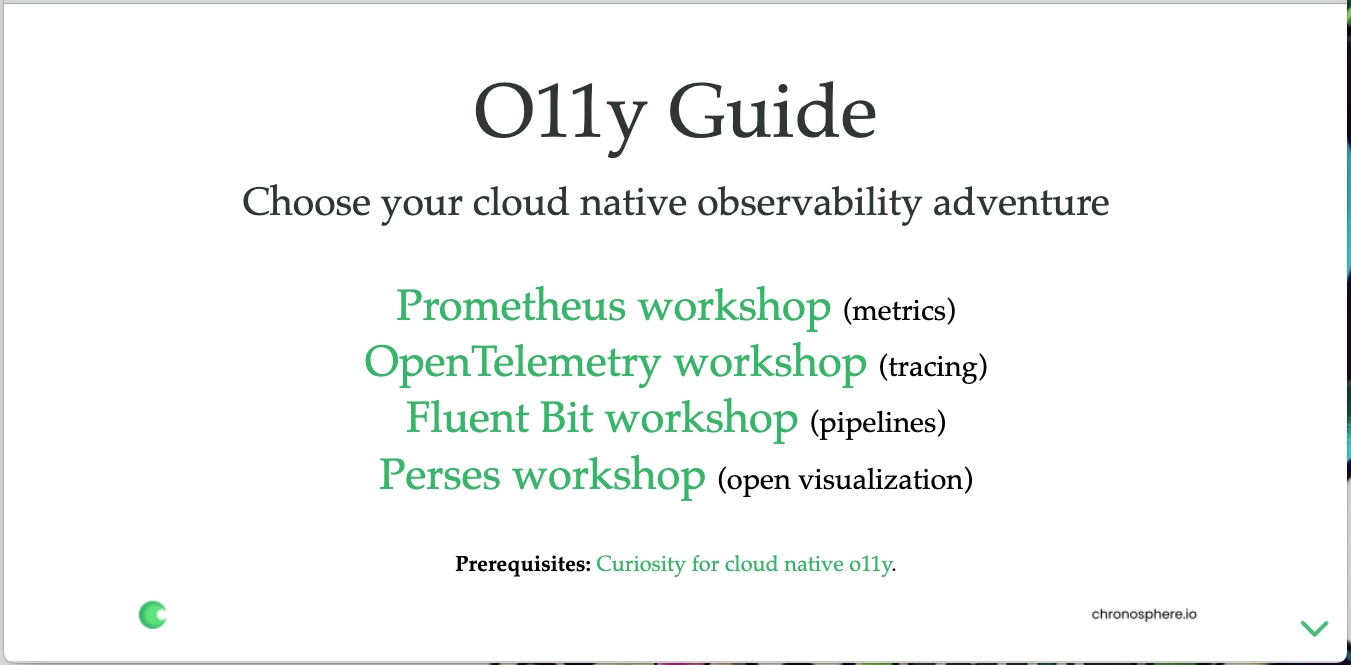
Prometheus is a well-known monitoring system and time series database that powers your metrics and alerts with the leading open-source monitoring solution. OpenTelemetry provides high-quality, ubiquitous, and portable telemetry to enable effective observability. Fluent Bit provides you with an end-to-end observability pipeline, with a super fast, lightweight, and highly scalable logging, metrics, and traces processor and forwarder. Perses is the new kid on the block, providing an open specification for dashboards focused on Prometheus and other data sources.
This hands-on, free, self-paced observability workshop collection takes you through all of the above tooling.
Start leveraging the synergies between observability and platform engineering today, helping your developers create better cloud-native applications while simultaneously enhancing their experience working on your platform.
Published at DZone with permission of Eric D. Schabell, DZone MVB. See the original article here.
Opinions expressed by DZone contributors are their own.


Comments