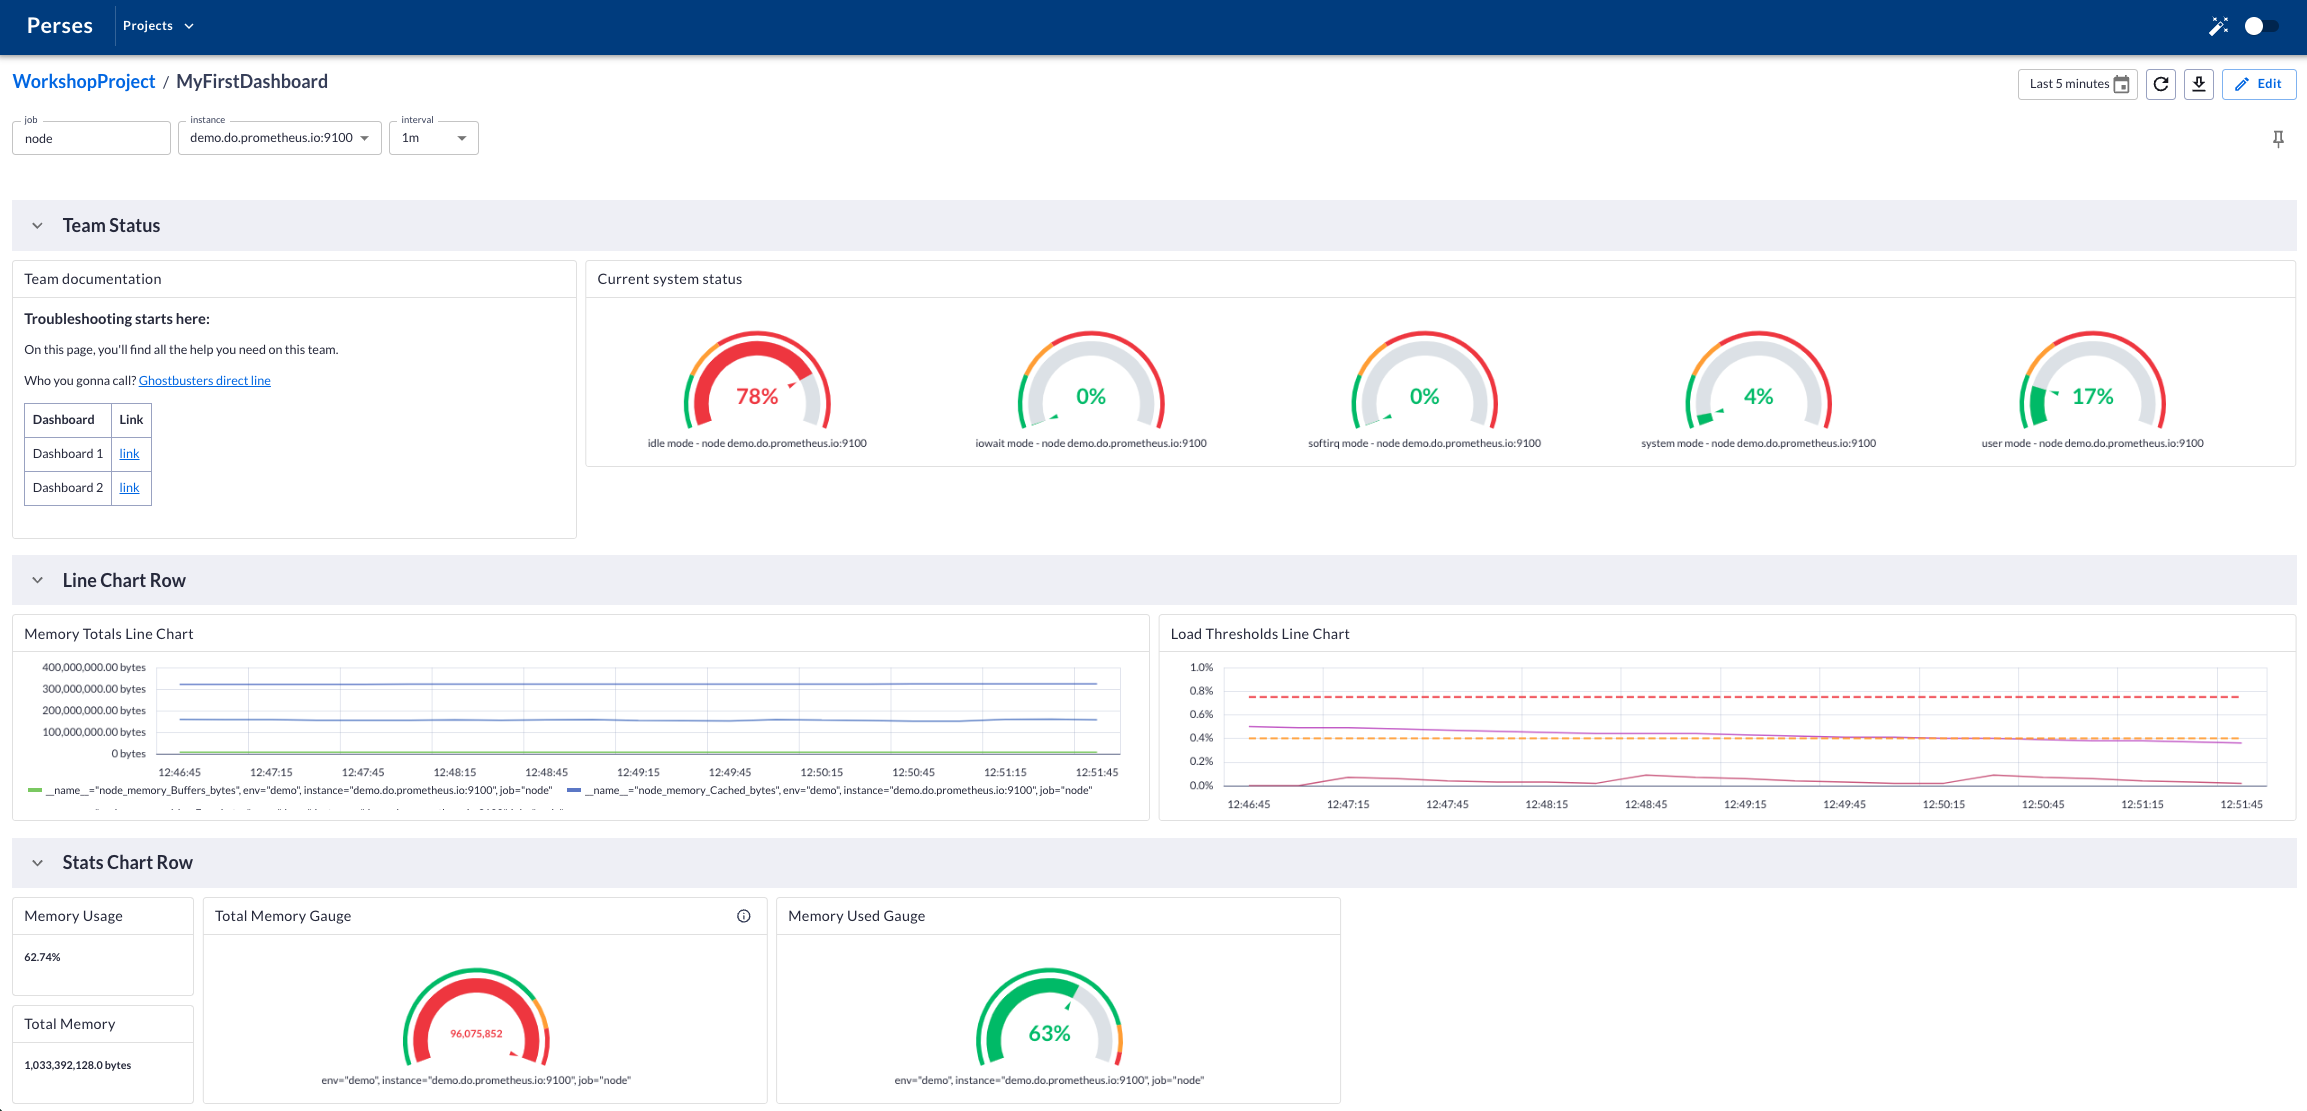
O11y Guide: Exploring Perses Dashboards
Continue the exploration of an open-source project, Perses, and get one step closer to creating your own dashboards and visualizations!
Join the DZone community and get the full member experience.
Join For FreeIn this eighth installment of the series covering my journey into the world of cloud-native observability, I'm continuing to explore an open-source project called Perses. If you missed any of the previous articles, head on back to the introduction for a quick update.
After laying out the groundwork for this series in the initial article, I spent some time in the second article sharing who the observability players are. I also discussed the teams that these players are on in this world of cloud-native o11y. For the third article, I looked at the ongoing discussion around monitoring pillars versus phases. In the fourth article, I talked about keeping your options open with open-source standards. In the fifth article in this series, I talked about bringing monolithic applications into the cloud-native o11y world. In my sixth article, I provided you with an introduction to a new open-source dashboard and visualization project and shared how to install the project on your local developer machine. In the previous and seventh article, I explored the API and tooling provided by the Perses project.
In this eighth article, I'm diving into understanding what makes up a Perses dashboard. This is a preview of the fourth lab developed for my hands-on workshop dedicated to exploring dashboards and visualization.
Being a developer from my early days in IT, it's been very interesting to explore the complexities of cloud-native o11y. Monitoring applications goes way beyond just writing and deploying code, especially in the cloud-native world. One thing remains the same: maintaining your organization's architecture always requires both a vigilant outlook and an understanding of available open standards.
This article is part of my ongoing effort to get practical hands-on experience in the cloud-native o11y world. I'm going to walk you through a portion of the Perses dashboard data model, get you started with a basic template for a minimal dashboard, and set the stage for the next lab where you will start designing components for laying out in your first dashboard. This is one lab in the more extensive free online workshop. Feel free to start from the very beginning of this workshop here if you missed anything previously:
Now let's dive into the Perses data model. Note this article is only a short summary, so please see the complete lab found online as lab 4.4 here to work through the data model for dashboards yourself:
The following is a short overview of what is in this specific lab of the Perses workshop.
Exploring Dashboards
Each lab starts with a goal. In this case, it is fairly simple: to understand what the basic data model is for building dashboards with the Perses project.
This lab explores the Perses dashboard resource, specifically how the data model consists of certain elements that make up the basic template for displaying a dashboard. For this lab, we work in a JSON formatted resource file with all examples shown, but you can also make use of the YAML format if you so desire.
At the highest level of the dashboard specification, you have three elements:
- Kind
- Metadata
- Spec
You've seen examples of the kinds of resources you can specify within the Kind element, such as a project, a dashboard, a datasource, or a globaldatasource. You are defining the type of resource this file will hold.
The next element, Metadata, is used to define a name for the resource, and you can assign the project that the resource belongs to.
Finally, the Spec element stands for "specification," and its structure depends on the Kind of resource you are defining. For the rest of this lab, we are only going to dive into the dashboard specification. The rest of this lab spends time diving into each of these elements that make up a dashboard specification:
- Display - defining a component name and description
- Duration - defining a default time to look in the past for data (not for all specifications)
- Variables - defining a list of variables for use in components
- Panels - defining a component to gather data for visualizing on a dashboard using a query of metrics data
- Layouts - defining the look, feel, and location of a panel in the dashboard
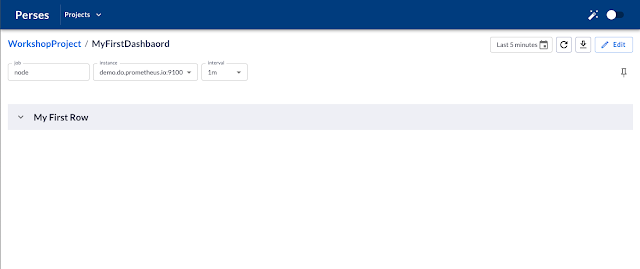
Each one is presented with a code example to help you understand their usage. Pulling them all together at the end, you are set up with a basic empty dashboard resource file, and using your knowledge of the Perses tooling from previous labs, you apply this resource to the running Perses server. This leaves you ready for the next lab where you will start designing your first dashboard.

You're now one step closer to creating your own dashboards and visualizations!
More To Come
Next up, I take you farther into the Perses project with more workshop materials to share. Stay tuned for more insights into the real, practical experience as my cloud native o11y journey continues.
Published at DZone with permission of Eric D. Schabell, DZone MVB. See the original article here.
Opinions expressed by DZone contributors are their own.


Comments