O11y Guide, Cloud-Native Observability Pitfalls: Ignoring Existing Landscape
Continuing in this series examining the common pitfalls of cloud-native observability, take a look at how ignoring our existing landscape hurts your budget.
Join the DZone community and get the full member experience.
Join For FreeAre you looking at your organization's efforts to enter or expand into the cloud-native landscape and feeling a bit daunted by the vast expanse of information surrounding cloud-native observability? When you're moving so fast with agile practices across your DevOps, SREs, and platform engineering teams, it's no wonder this can seem a bit confusing.
Unfortunately, the choices being made have a great impact on both your business, your budgets, and the ultimate success of your cloud-native initiatives that hasty decisions upfront lead to big headaches very quickly down the road.
In the previous article, we looked at the problem of underestimating cardinality in our cloud-native observability solutions. Now it's time to move on to another common mistake organizations make, that of ignoring our existing landscape. By sharing common pitfalls in this series, the hope is that we can learn from them.
This article could also have been titled, "Underestimating Our Existing Landscape." When we start planning to integrate our application landscape into our observability solution, we often end up with large discrepancies between planning and outcomes.
They Can't Hurt Me
The truth is we have a lot of applications out there in our architecture. The strange thing is during the decision-making process around cloud native observability and scoping solutions, they often are forgotten. Well, not necessarily forgotten, but certainly underestimated. The cost that they bring is in the hidden story around instrumentation.
We have auto-instrumentation that suggests it's quick and easy, but often does not bring the exactly needed insights. On top of that, auto-instrumentation generates extra data from metrics and tracing activities that we are often not that interested in.
Manual instrumentation is the real cost to provide our exact insights and the data we want to watch from our application landscape. This is what often results in unexpected or incorrectly scoped work (a.k.a., costs) with it as we change, test, and deploy new versions of existing applications.
We want to stay with open source and open standards in our architecture, so we are going to end up in the cloud native standards found within the Cloud Native Computing Foundation. With that in mind, we can take a closer look at two technologies for our cloud-native observability solution: one for metrics and one for traces.
Instrumenting Metrics
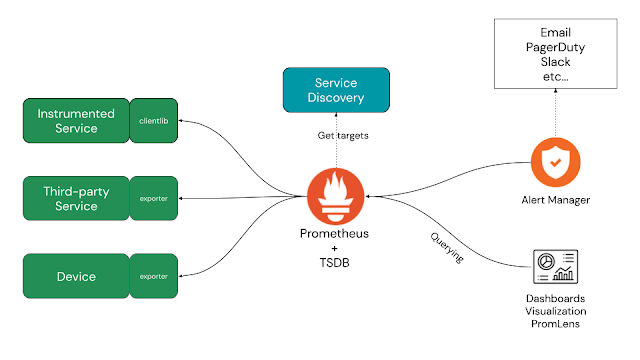
Widely adopted and accepted standards for metrics can be found in the Prometheus project, including time-series storage, communication protocols to scrape (pull) data from targets, and PromQL, the query language for visualizing the data. Below you see an outline of the architecture used by Prometheus to collect metrics data.
.png)
There are client libraries, exporters, and standards in communication to detect services across various cloud-native technologies. They make it look extremely low effort to ensure we can start collecting meaningful data in the form of standardized metrics from your applications, devices, and services.
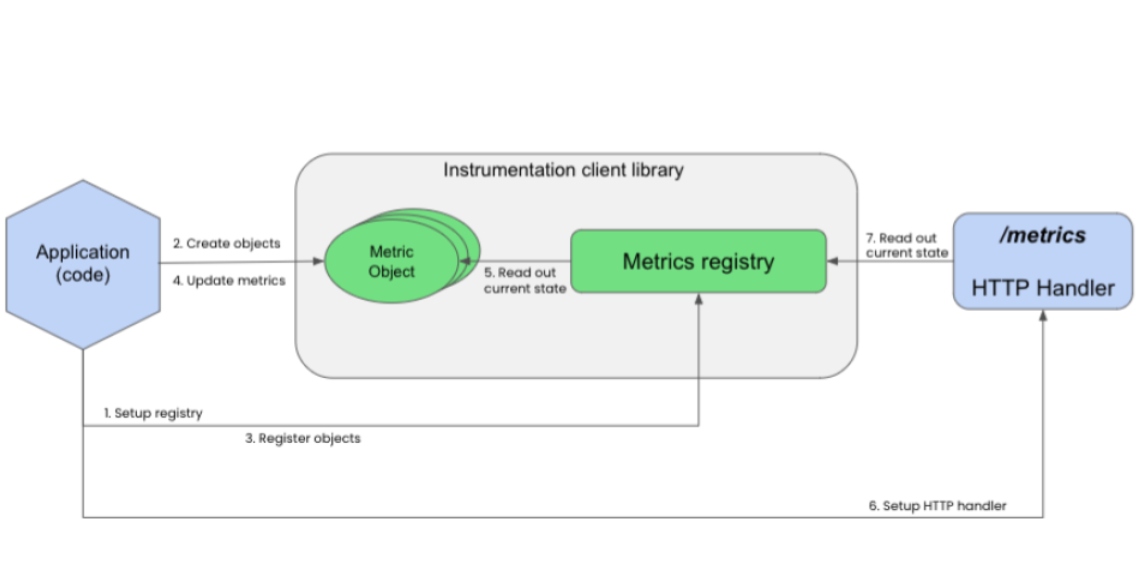
The reality is that we need to look much closer at scoping the efforts required to instrument our applications. Below you see an example of what is necessary to (either auto or manually) instrument a Java application. The process is the same for either method.

While some of the data can be automatically gathered, that's just generic Java information for your applications and services. Manual instrumentation is the cost you can't forget, where you need to make code changes and redeploy.
While it's nice to discuss manual instrumentation in the abstract sense, nothing beats getting hands-on with a real coding example. To that end, we can dive into what it takes to both auto and manually instrument a simple Java application in this workshop lab.
Below you see a small example of the code you will apply to your example application in one of the workshop exercises to create a gauge metric:
// Start thread and apply values to metrics.
Thread bgThread = new Thread(() -> {
	while (true) {
		try {
			counter.labelValues("ok").inc();
			counter.labelValues("ok").inc();
			counter.labelValues("error").inc();
			gauge.labelValues("value").set(rand(-5, 10));
			TimeUnit.SECONDS.sleep(1);
		} catch (InterruptedException e) {
			e.printStackTrace();
		}
	}
});
bgThread.start();
Be sure to explore the free online workshop and get hands-on experience with what instrumentation for your Java applications entails.
Instrumenting Traces
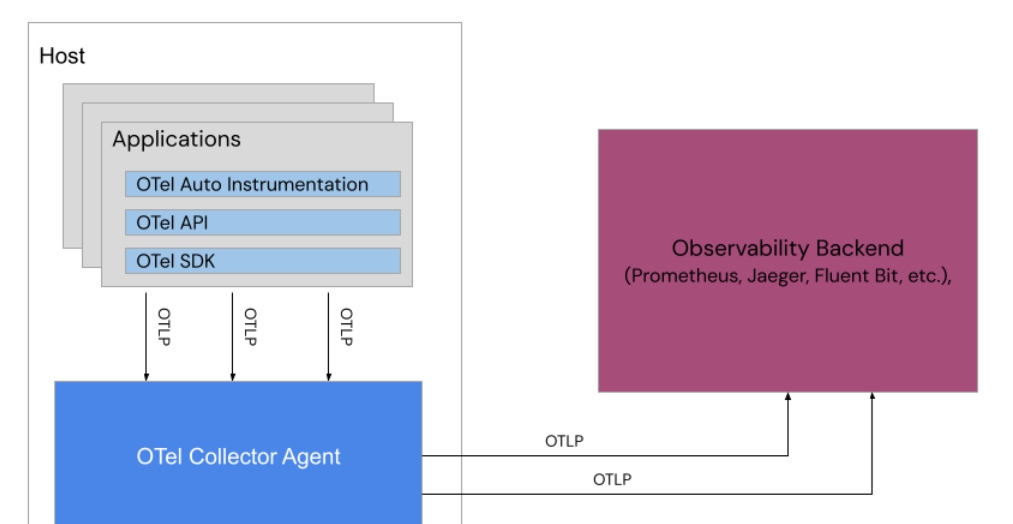
In the case of tracing, a widely adopted and accepted standard is the OpenTelemetry (OTel) project, which is used to instrument and collect telemetry data through a push mechanism to an agent installed on the host. Below you see an outline of the architecture used by OTel to collect telemetry data:

Whether we choose automatic or manual instrumentation, we have the same issues as previously discussed above. Our applications and services all require some form of cost to instrument our applications and we can't forget that when scoping our observability solutions.
The telemetry data is pushed to an agent, known as the OTel Collector, which is installed on the application's host platform. It uses a widely accepted open standard to communicate known as the OpenTelemetry Protocol (OTLP). Note that OTel does not have a backend component, instead choosing to leverage other technologies for the backend and the collector sends all processed telemetry data onwards to that configured backend.
Again, it's nice to discuss manual instrumentation in the abstract sense, but nothing beats getting hands-on with a real coding example. To that end, we can dive into what it takes to programmatically instrument a simple application using OTel in this workshop lab.
Below, you see a small example of the code that you will apply to your example application in one of the workshop exercises to collect OTel telemetry data, and later in the workshop, view in the Jaeger UI:
...
from opentelemetry.trace import get_tracer_provider, set_tracer_provider

set_tracer_provider(TracerProvider())
get_tracer_provider().add_span_processor(
	BatchSpanProcessor(ConsoleSpanExporter())
)

instrumentor = FlaskInstrumentor()
app = Flask(__name__)
instrumentor.instrument_app(app)
...
Be sure to explore the free online workshop and get hands-on yourself to experience how much effort it is to instrument your applications using OTel.
The road to cloud-native success has many pitfalls. Understanding how to avoid the pillars and focusing instead on solutions for the phases of observability will save much wasted time and energy.
Coming Up Next
Another pitfall organizations struggle with in cloud native observability is the protocol jungle. In the next article in this series, I'll share why this is a pitfall and how we can avoid it wreaking havoc on our cloud-native observability efforts.
Published at DZone with permission of Eric D. Schabell, DZone MVB. See the original article here.
Opinions expressed by DZone contributors are their own.


Comments