No Spark Streaming, No Problem
In this article, learn how one of the best streaming databases (RisingWave) can level up your streaming pipeline with less code.
Join the DZone community and get the full member experience.
Join For FreeSpark is one of the most popular and widely used big data processing frameworks in the world. It has a large open-source community, with continuous development, updates, and improvements being made to the platform. Spark has gained popularity due to its ability to perform in-memory data processing, which significantly accelerated the data processing times compared to traditional batch processing systems like Hadoop MapReduce.
However, all that glitters is not gold. Spark is well known for being one of the best data processing frameworks available in the market, thanks to its capacity to process batch data, but when it comes to streaming data, Spark can be challenging if you don’t have previous experience working with any streaming framework.
The difficulty of learning Spark Streaming, like any other streaming framework, can vary depending on an individual’s background, experience, and familiarity with related concepts. When it comes to streaming data, it doesn’t matter if we have prior experience or if we are just starting. We need to know/learn about distributed systems, event-driven concepts, real-time data processing concepts, and, of course, the syntax for the specific framework that is being used.
Whether you are an experienced engineer or you are just getting started, you need to know that you don’t have to worry about Spark Streaming. There is a solution that increases the performance of your streaming pipeline, decreases the complexity of your code, and matches perfectly with Spark. The solution is a streaming database.
First things first. You may be wondering what a streaming database is. In a nutshell, a streaming database is a type of database that is designed to handle continuous and real-time data streams. There are many streaming databases in the market, but in this article, we are going to learn how one of the best streaming databases (RisingWave) can level up your streaming pipeline with less code.
Streaming Pipeline Architecture With Spark Streaming
Every company has its own needs, and the technologies vary depending on the specific use case, but in general, we can find the following architecture in any streaming pipeline.
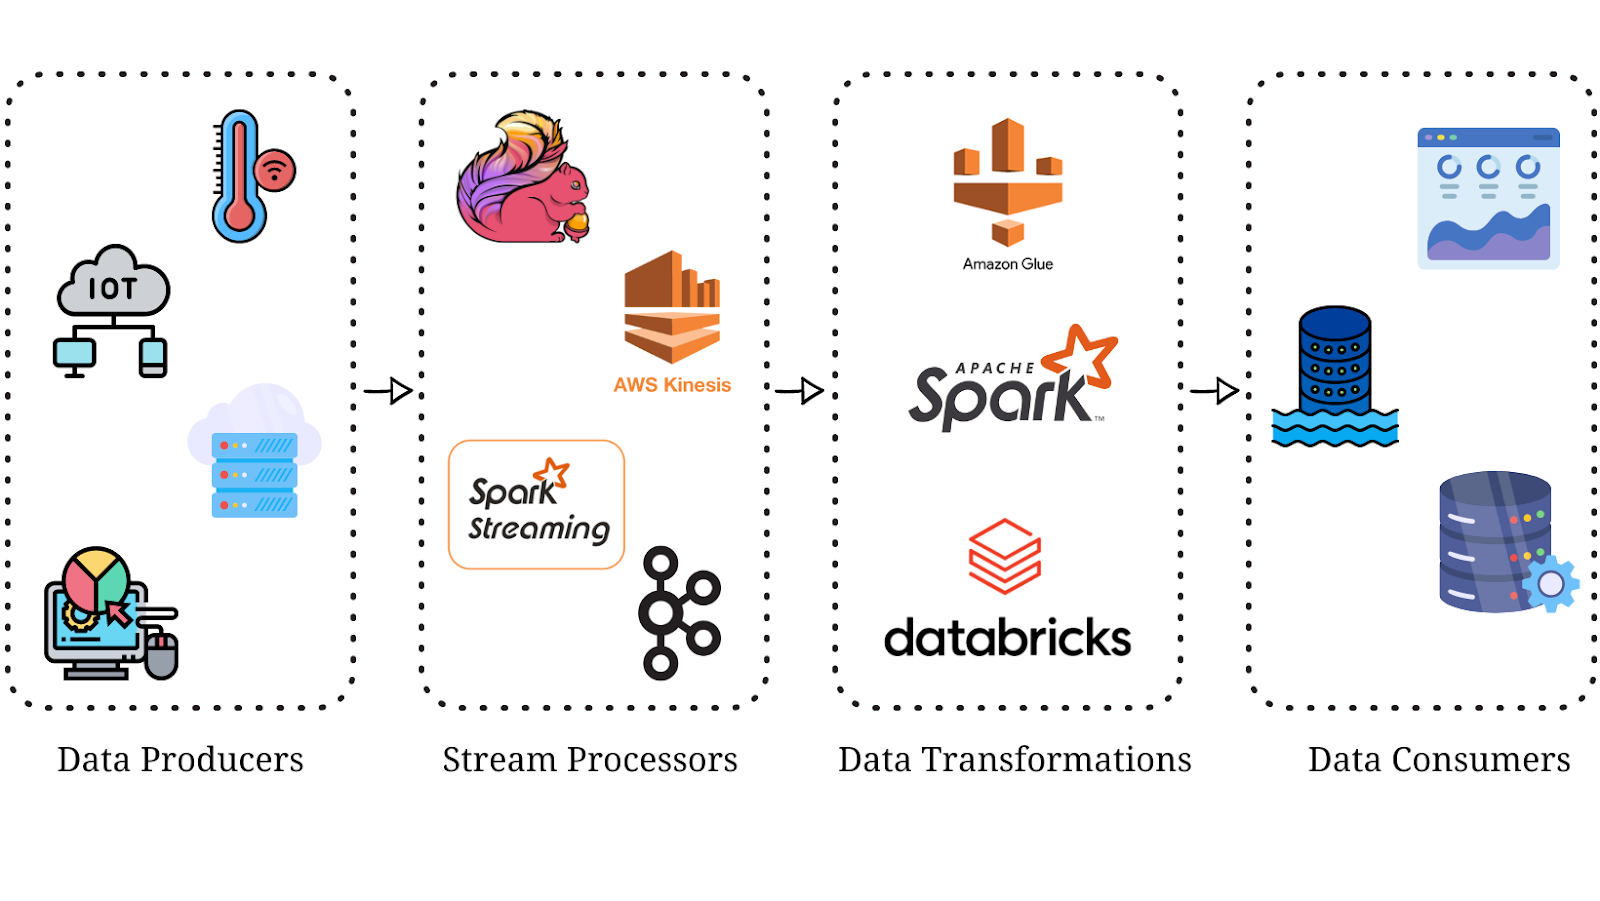
Data Producers
Data producers (IoT devices, sensors, server logs, clickstream data, app activity) are the data sources that continuously generate data events into the pipeline. These data events are time-stamped and represent individual pieces of data that need to be processed, analyzed, or stored in real time.
Stream Processors
Stream processors (Kafka, Flink, Spark Streaming, Amazon Kinesis, Google Cloud Dataflow) are the main components responsible for ingesting data as it flows through the pipeline. Stream processors play a crucial role in achieving low-latency and high-throughput data processing in streaming applications.
Data Transformations
Data transformation (Spark, Databricks, Upsolver, Google Cloud BigQuery, AWS Glue) is the process of modifying, enriching, or reformatting the real-time data as it flows through the pipeline. Most of the time, the transformations are done in a Spark-friendly environment. Data transformations are the most difficult part to develop in every streaming pipeline. The reason is not because there is a lack of technologies but because there is a lack of knowledge on how to cleanse data, perform aggregations, filter, map, join, and improve the application performance according to the cluster’s hardware (Spark tuning).
Data Consumers
Data consumers (databases, data lakes, real-time dashboards) are the destinations of the processed data that flows through the pipeline. Once the data has been ingested, processed, and transformed in real-time, it is now sent to the data consumers for further analysis, storage, or, in most cases, visualization.
Streaming Pipeline Architecture With RisingWave
Now that we know the architecture of a streaming pipeline let’s learn how we can improve it by implementing a streaming database, in this case, RisingWave.

As you can see, the data producers and data consumers are the same, but the stream processor has been replaced by the streaming database RisingWave. This small change is a huge improvement to the streaming pipeline. These are some of the improvements the pipeline got thanks to the implementation of a streaming database:
- The streaming and processing steps are done together.
- Spark can be used as a complement in the case a second processing is needed, and the use case requires Spark.
- The complexity of the streaming pipeline has been reduced. Streaming frameworks like Flink or Spark Streaming require a deep knowledge level, but streaming databases ease the complexity.
- Easier to maintain, develop, and test thanks to the database optimizer that RisingWave has.
Building a Streaming Pipeline
The Spark Streaming Approach
Now that we have learned how to level up our streaming pipeline using a streaming database let’s review how easy it is to build a streaming pipeline using a streaming database versus all the challenges we face when the pipeline is developed without a streaming database.
Let’s start by understanding how a streaming pipeline is developed without a streaming database and using Spark Streaming to stream and process the data.
The first stage in any streaming database is the data producer. In this case, we will be processing the data from an IoT sensor located in a house. The dataset can be found on Kaggle as Room Occupancy Detection Data (IoT sensor), and it sensors the temperature, humidity, light, CO2 level, humidity ratio, and occupancy of the room every minute. This is an example of how the dataset looks like.
The sensor delivers a new record every minute, so we need to process the streaming data. Let’s start building the Spark Streaming by adding all the libraries needed and declaring the schema for the streaming data.
from pyspark.sql import SparkSession
from pyspark.sql.types import StructType, IntegerType, TimestampType, DoubleType
from pyspark.sql.functions import count, to_date, avg, round

spark = SparkSession.builder.master("local[*]").appName("IoT Streaming Pipeline").getOrCreate()

sensor_schema = StructType() \
      .add("timestamp", TimestampType(), True) \
      .add("temperature", DoubleType(), True) \
      .add("humidity", DoubleType(), True) \
      .add("light", DoubleType(), True) \
      .add("co2", DoubleType(), True) \
      .add("humidity_ratio", DoubleType(), True) \
      .add("occupancy", IntegerType(), True)
Now that we have the schema defined, we can declare the streaming data frame, and we will add another column to cast the timestamp column as a date type.
sensor_streaming_df = spark \
                        .readStream \
                        .format("csv") \
                        .schema(sensor_schema) \
                        .option("header", True) \
                        .option("maxFilesPerTrigger", 1) \
                        .load("data/")

sensor_streaming_df = sensor_streaming_df.withColumn("date", to_date("timestamp"))
It’s important to understand how streaming data frames work. So, if you’re unfamiliar with the term, I highly recommend you read this article to get a better idea. It’s also important to mention that we need to define the specific options we need depending on the use case. In this case, the IoT sensor delivers data every minute, so we will be getting a new file every minute, and we need to read one file at a time. That’s the reason why we set the option “maxFilesPerTrigger” to 1.
We are all set to start reading the streaming data, and we can visualize it by writing it to the console using the below command and waiting until all the data is processed.
query = sensor_streaming_df.select("*").writeStream.format("console").start()
query.awaitTermination()
The data from the IoT sensor is streamed, processed, and printed in batches. Every batch is sent by the sensor, and Spark Streaming processes it. This is what the output looks like.
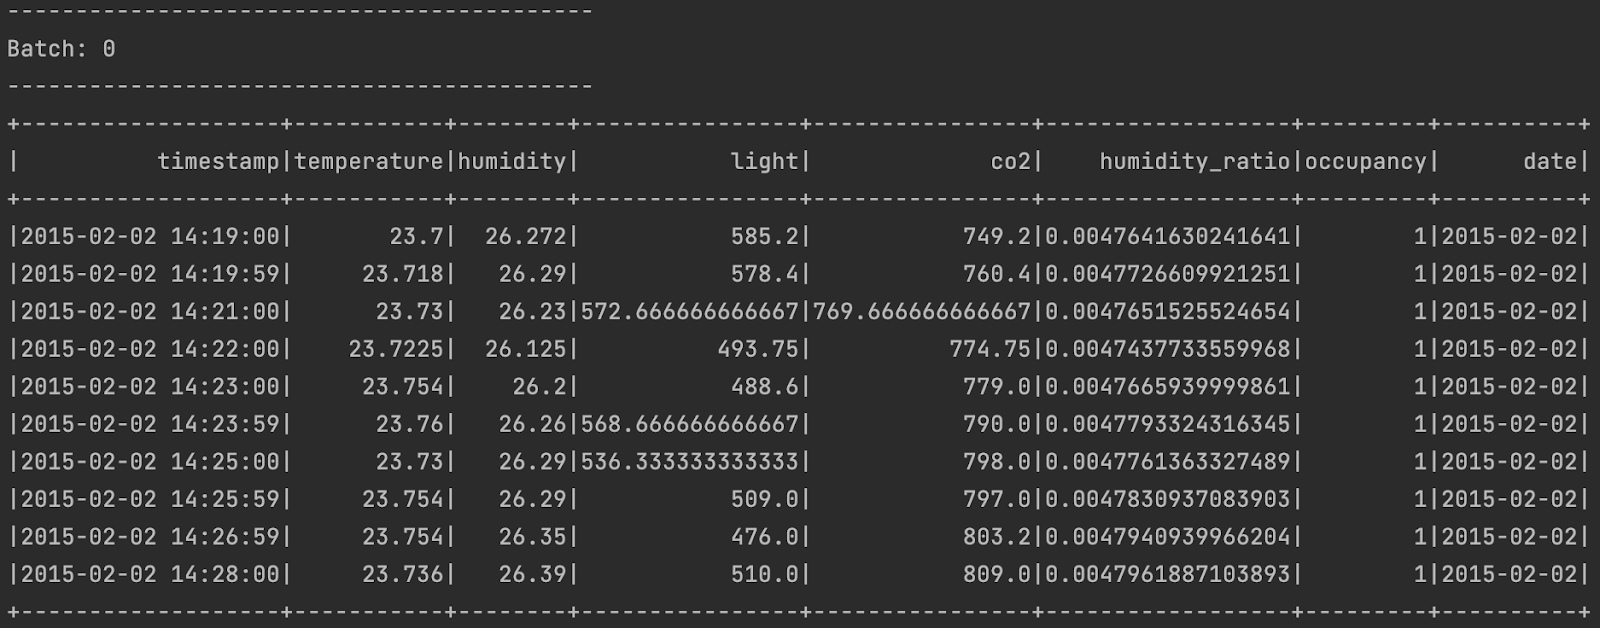
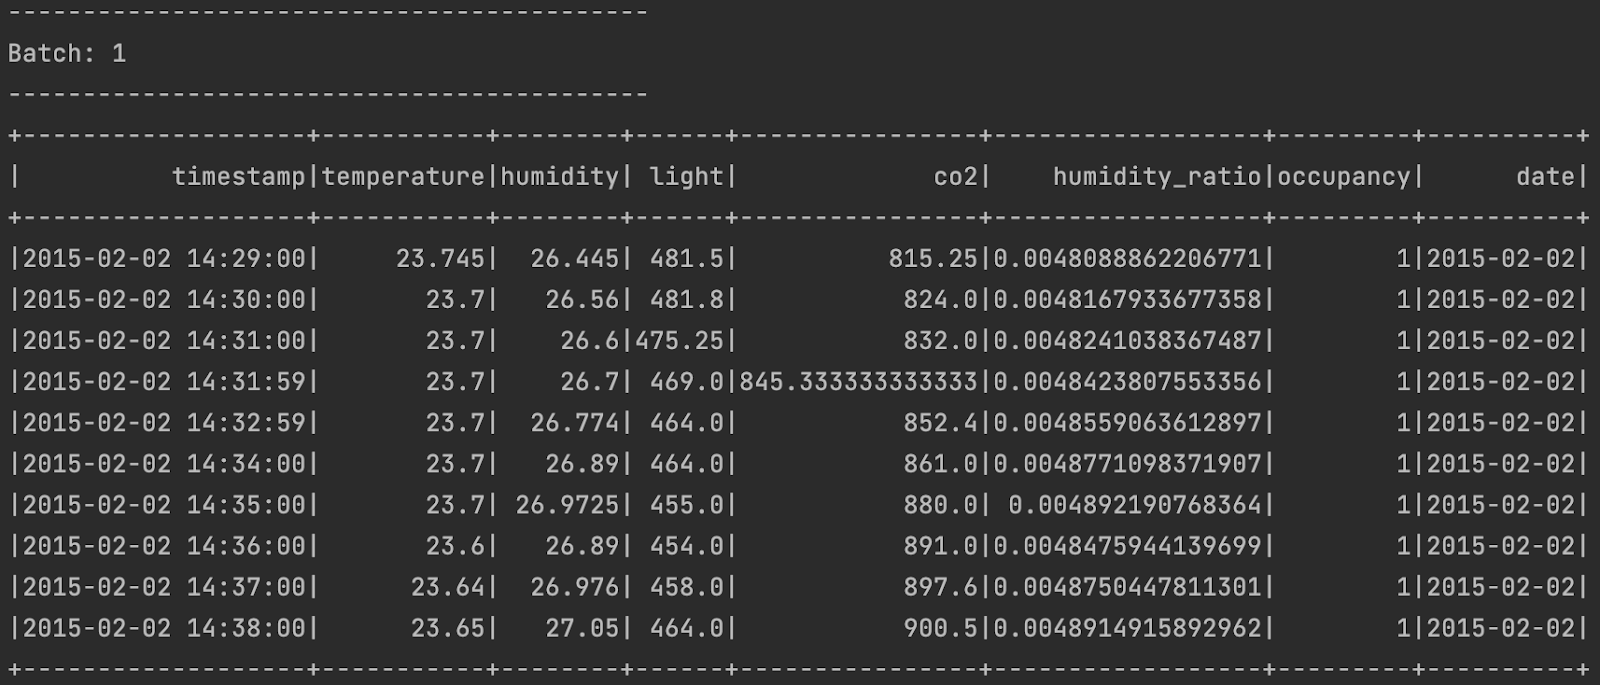
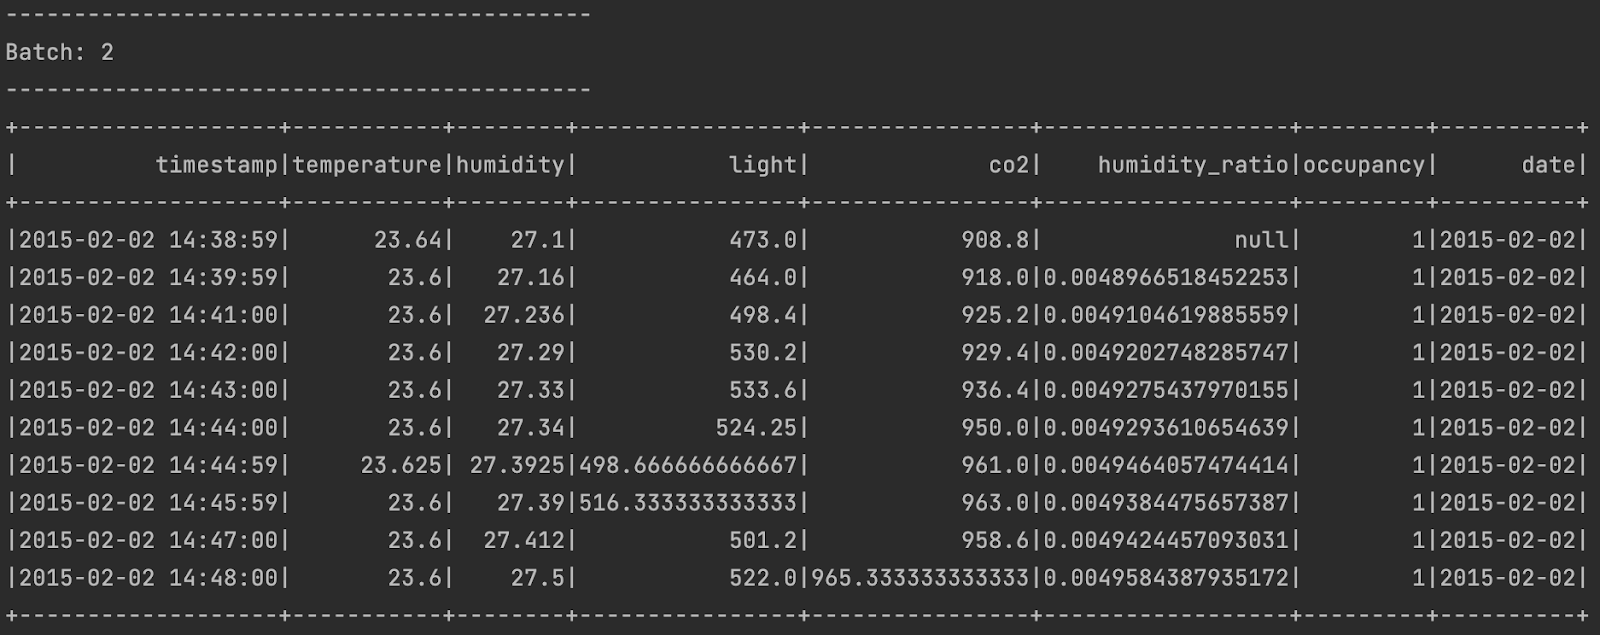
Now, it’s time to apply some data transformations and do some aggregations. Since the sensor sends data every minute, let’s calculate the daily average temperature in Celsius, convert it to Fahrenheit, and then calculate the daily average value for the other metrics, too, using Spark Streaming.
query = sensor_streaming_df\
    .groupby("date")\
    .agg(count("*").alias("records_count"),
         round(avg("temperature"), 2).alias("avg_c_temp"),
         round((9/5 * avg("temperature")) + 32, 2).alias("avg_f_temp"),
         round(avg("humidity"), 2).alias("avg_humidity"),
         round(avg("light"), 2).alias("avg_light"),
         round(avg("co2"), 2).alias("avg_co2"),
         round(avg("humidity_ratio"), 2).alias("avg_hum_ratio"))\
    .writeStream.format("console").outputMode("complete").start()

query.awaitTermination()
Spark Streaming reads the stream batches and updates the aggregation values. Once all the stream data has been delivered, we can see the final results as below.

The Streaming Database (RisingWave) Approach
We have learned how a streaming database is built using Spark Streaming. Now it’s time to build the same streaming pipeline but level it up using the streaming database RisingWave (if you want to know how to get started with RisingWave, I recommend you to go through their getting started website). For this pipeline, we have the same IoT data producer; the data is streamed via a Kafka topic, and the streaming database processes the data.
Let’s start by ingesting the data into the streaming database RisingWave. To start ingesting the data, we need to create a data source. The streaming data is delivered to the streaming database via the Kafka topic IoT, so let's establish the connection between the Kafka topic and the data source.
CREATE SOURCE IF NOT EXISTS iot_stream (
	timestamp timestamp,
	temperature double,
	humidity double,
	light double,
	co2 double,
    humidity_ratio double,
    occupancy double
)
WITH (
	connector = 'kafka',
   	topic = 'iot',
	properties.bootstrap.server='127.0.0.1:9092',
	scan.startup.mode = 'earliest'
)
ROW FORMAT JSON;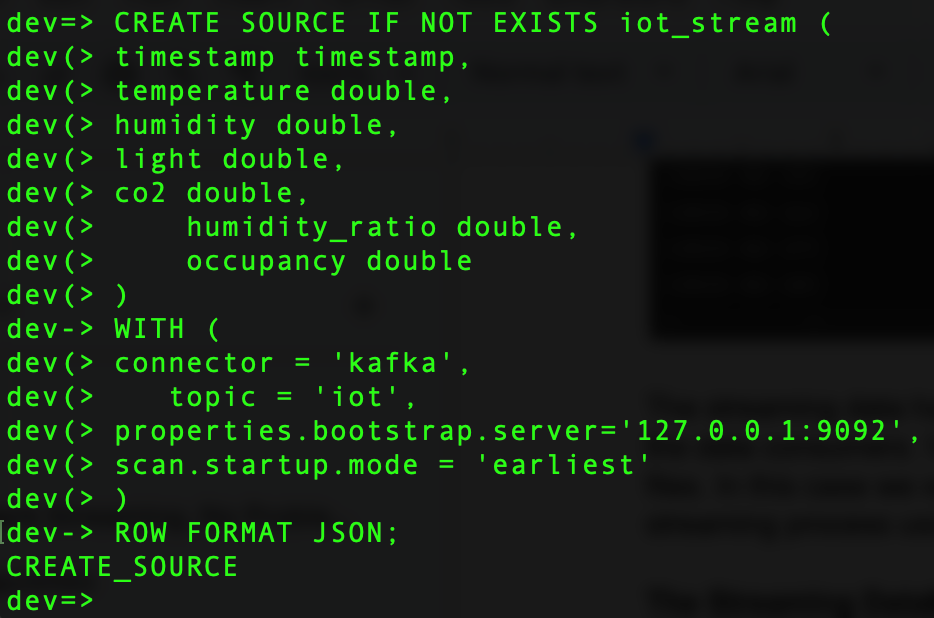
Now that we have created the data source, we need to create the materialized view that will allow us to query the data, and here is where the magic happens. We can create the materialized view with the same transformations as we did with Spark Streaming, but easier and faster, thanks to the fact that RisingWave has a database optimizer that abstracts the complexity from the user.
CREATE MATERIALIZED VIEW iot_sensor AS
    SELECT
        timestamp::date AS date,
        COUNT(*) AS records_count,
        ROUND(AVG(temperature)) AS avg_c_temp,
        ROUND((9/5.0 * AVG(temperature)) + 32) AS avg_f_temp,
        ROUND(AVG(humidity)) AS avg_humidity,
        ROUND(AVG(light)) AS avg_light,
        ROUND(AVG(co2)) AS avg_co2,
        ROUND(AVG(humidity_ratio)) AS avg_hum_ratio
    FROM iot_stream
    GROUP BY timestamp::date;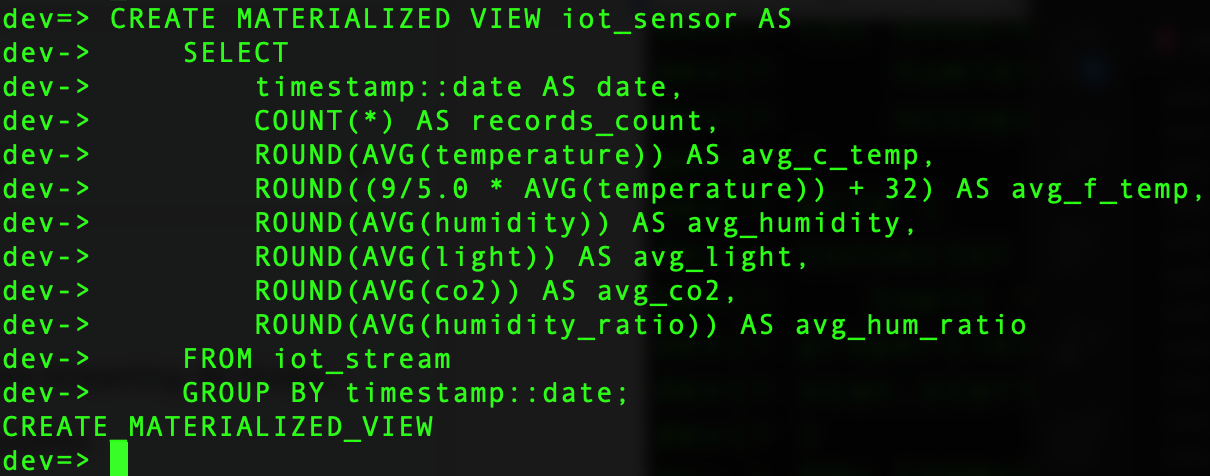
With the materialized view created, we can see how the data is being streamed and processed at the same time.

Once all the data has been streamed, we can query the materialized view, and we can see how the data has been processed in real time.
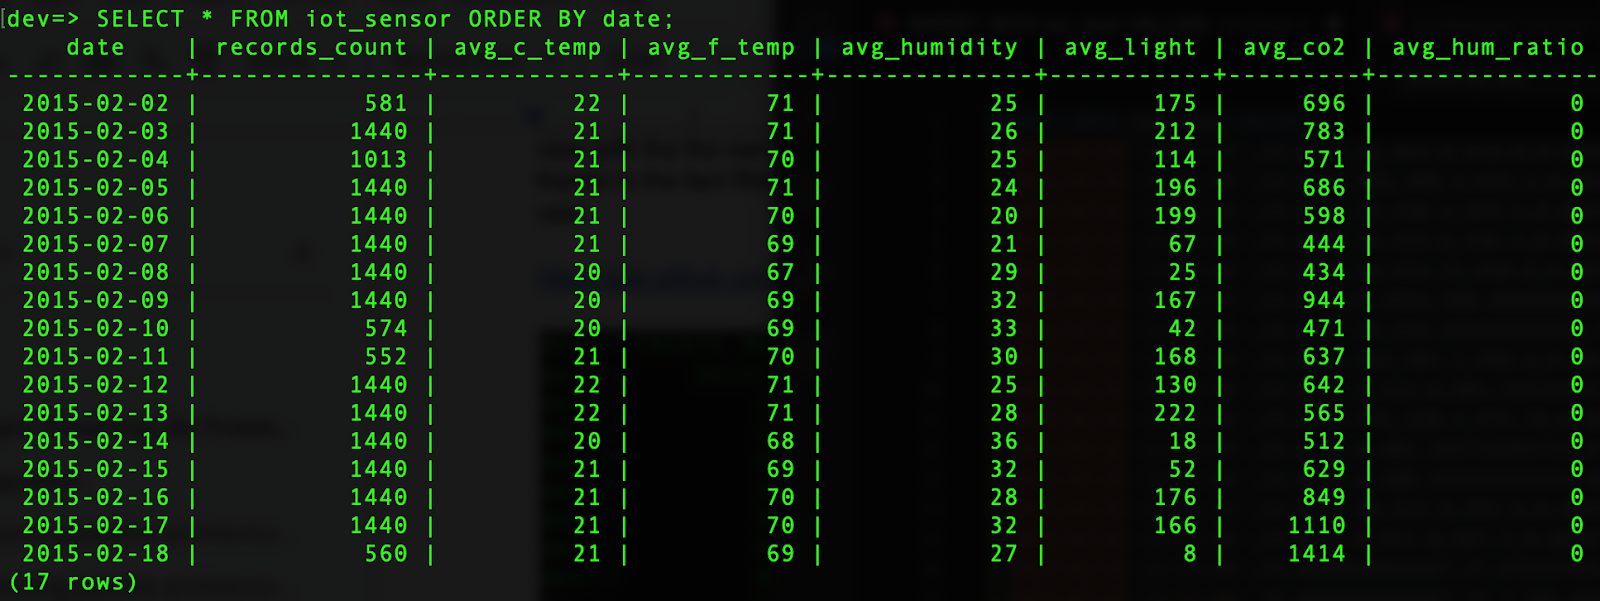
Now, the data is ready to be delivered to the data consumers. RisingWave allows us to deliver the data in multiple ways using data sinks, or we can use Spark to store the data in multiple formats such as parquet, CSV, JSON, orc, etc.
As you can see, using a streaming database reduces the development process difficulty, improves the performance and capabilities of the streaming database, and fits perfectly with the Spark architecture used in most of the streaming pipelines nowadays.
Conclusion
In this article, we learned how the streaming database RisingWave is the perfect match for any streaming pipeline because of its streaming and processing capabilities. RisingWave complements the Spark architecture and reduces the complexity and skill level needed when a streaming pipeline is built using only Spark Streaming, such as Spark tunning, to improve the performance of a Spark application. All of this is thanks to the database optimizer implemented that gets rid of the complexity of the streaming process from the user.
Opinions expressed by DZone contributors are their own.

Comments