MySQL vs. Neo4j on a Large-Scale Graph Traversal
Join the DZone community and get the full member experience.
Join For Freethis post presents an analysis of mysql (a relational database) and neo4j (a graph database) in a side-by-side comparison on a simple graph traversal.

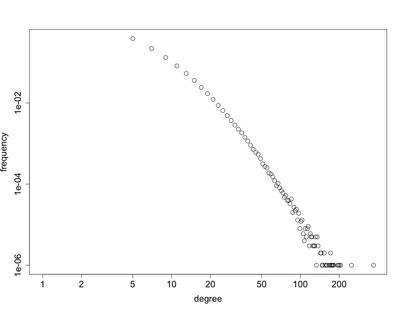
the data set that was used was an artificially generated graph with natural statistics. the graph has 1 million vertices and 4 million edges. the
degree distribution
of this graph on a
log-log plot
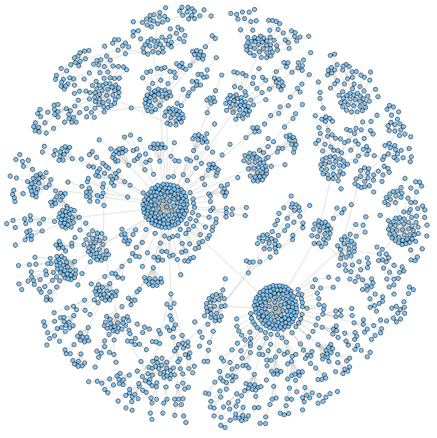
is provided below. a visualization of a 1,000 vertex subset of the graph is diagrammed above.

loading the graph
the graph data set was loaded both into mysql and neo4j. in mysql a single table was used with the following schema.
create table graph (
  outv int not null,
  inv int not null
);
create index outv_index using btree on graph (outv);
create index inv_index using btree on graph (inv);
after loading the data, the table appears as below. the first line reads: “vertex 0 is connected to vertex 1.”
mysql> select * from graph limit 10;
+------+-----+
| outv | inv |
+------+-----+
|    0 |   1 |
|    0 |   2 |
|    0 |   6 |
|    0 |   7 |
|    0 |   8 |
|    0 |   9 |
|    0 |  10 |
|    0 |  12 |
|    0 |  19 |
|    0 |  25 |
+------+-----+
10 rows in set (0.04 sec)
the 1 million vertex graph data set was also loaded into neo4j. in gremlin , the graph edges appear as below. the first line reads: “vertex 0 is connected to vertex 992915.”
gremlin> g.e[1..10]
==>e[183][0-related->992915]
==>e[182][0-related->952836]
==>e[181][0-related->910150]
==>e[180][0-related->897901]
==>e[179][0-related->871349]
==>e[178][0-related->857804]
==>e[177][0-related->798969]
==>e[176][0-related->773168]
==>e[175][0-related->725516]
==>e[174][0-related->700292]
warming up the caches
before traversing the graph data structure in both mysql and neo4j, each database had a “ warm up ” procedure run on it. in mysql, a “select * from graph” was evaluated and all of the results were iterated through. in neo4j, every vertex in the graph was iterated through and the outgoing edges of each vertex were retrieved. finally, for both mysql and neo4j, the experiment discussed next was run twice in a row and the results of the second run were evaluated.
traversing the graph
the traversal that was evaluated on each database started from some root vertex and emanated n-steps out. there was no sorting, no distinct-ing, etc. the only two variables for the experiments are the length of the traversal and the root vertex to start the traversal from. in mysql, the following 5 queries denote traversals of length 1 through 5. note that the “?” is a variable parameter of the query that denotes the root vertex.
select a.inv from graph as a where a.outv=?

select b.inv from graph as a, graph as b where a.inv=b.outv and a.outv=?

select c.inv from graph as a, graph as b, graph as c where a.inv=b.outv and b.inv=c.outv and a.outv=?

select d.inv from graph as a, graph as b, graph as c, graph as d where a.inv=b.outv and b.inv=c.outv and c.inv=d.outv and a.outv=?

select e.inv from graph as a, graph as b, graph as c, graph as d, graph as e where a.inv=b.outv and b.inv=c.outv and c.inv=d.outv and d.inv=e.outv and a.outv=?
for neo4j, the blueprints pipes framework was used. a pipe of length n was constructed using the following static method.
public static pipeline createpipeline(final integer steps) {
  final arraylist pipes = new arraylist();
  for (int i = 0; i < steps; i++) {
    pipe pipe1 = new vertexedgepipe(vertexedgepipe.step.out_edges);
    pipe pipe2 = new edgevertexpipe(edgevertexpipe.step.in_vertex);
    pipes.add(pipe1);
    pipes.add(pipe2);
  }
  return new pipeline(pipes);
}
for both mysql and neo4j, the results of the query (sql and pipes) were iterated through. thus, all results were retrieved for each query. in mysql, this was done as follows.
while (resultset.next()) {
  resultset.getint(finalcolumn);
}
in neo4j, this is done as follows.
while (pipeline.hasnext()) {
  pipeline.next();
}
experimental results
the artificial graph dataset was constructed with a “ rich get richer “, preferential attachment model . thus, the vertices created earlier are the most dense (i.e. highest number of adjacent vertices). this property was used to limit the amount of time it would take to evaluate the tests for each traversal. only the first 250 vertices were used as roots of the traversals. before presenting timing results, note that all of these experiments were run on a macbook pro with a 2.66ghz intel core 2 duo and 4gigs of ram at 1067 mhz ddr3. the packages used were java 1.6, mysql jdbc 5.0.8, and blueprints pipes 0.1.2.
java version "1.6.0_17"
java(tm) se runtime environment (build 1.6.0_17-b04-248-10m3025)
java hotspot(tm) 64-bit server vm (build 14.3-b01-101, mixed mode)
the following java virtual machine parameters were used:
-xmx1000m -xms500m
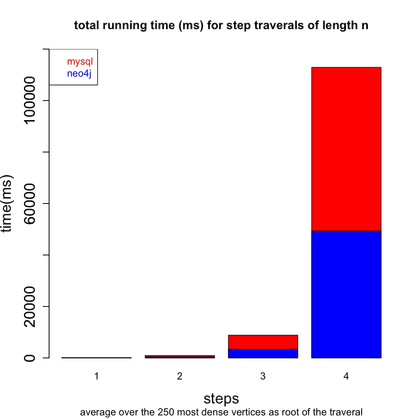
below are the total running times for both mysql (red) and neo4j (blue) for traversals of length 1, 2, 3, and 4.

the raw data is presented below along with the total number of vertices returned by each traversal—which, of course, is the same for both mysql and neo4j given that its the same graph data set being processed. also realize that traversals can loop and thus, many of the same vertices are returned multiple times. finally, note that only neo4j has the running time for a traversal of length 5. mysql did not finish after waiting 2 hours to complete. in comparison, neo4j took 14.37 minutes to complete a 5 step traversal.
[mysql steps-1] time(ms):124 -- vertices_returned:11360
[mysql steps-2] time(ms):922 -- vertices_returned:162640
[mysql steps-3] time(ms):8851 -- vertices_returned:2206437
[mysql steps-4] time(ms):112930 -- vertices_returned:28125623
[mysql steps-5] n/a

[neo4j steps-1] time(ms):27 -- vertices_returned:11360
[neo4j steps-2] time(ms):474 -- vertices_returned:162640
[neo4j steps-3] time(ms):3366 -- vertices_returned:2206437
[neo4j steps-4] time(ms):49312 -- vertices_returned:28125623
[neo4j steps-5] time(ms):862399 -- vertices_returned:358765631
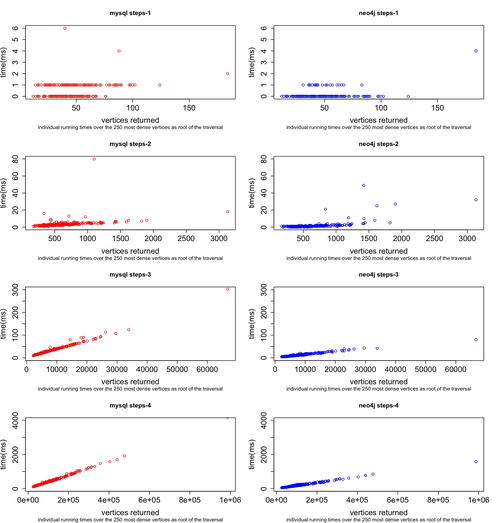
next, the individual data points for both mysql and neo4j are presented in the plot below. each point denotes how long it took to return n number of vertices for the varying traversal lengths.

finally, the data below provides the number of vertices returned per millisecond (on average) for each of the traversals. again, mysql did not finish in its 2 hour limit for a traversal of length 5.
[mysql steps-1] vertices/ms:91.6128847554668
[mysql steps-2] vertices/ms:176.399127537985
[mysql steps-3] vertices/ms:249.286746556076
[mysql steps-4] vertices/ms:249.053599519823
[mysql steps-5] n/a

[neo4j steps-1] vertices/ms:420.740351166341
[neo4j steps-2] vertices/ms:343.122344772028
[neo4j steps-3] vertices/ms:655.507125256186
[neo4j steps-4] vertices/ms:570.360621871775
[neo4j steps-5] vertices/ms:416.00886711325
conclusion
in conclusion, given a traversal of an artificial graph with natural statistics, the graph database neo4j is more optimal than the relational database mysql. however, no attempts have been made to optimize the java vm, the sql queries, etc. these experiments were run with both neo4j and mysql “out of the box” and with a “natural syntax” for both types of queries.
source:
http://markorodriguez.com/2011/02/18/mysql-vs-neo4j-on-a-large-scale-graph-traversal/
Opinions expressed by DZone contributors are their own.

Comments