Monitoring Using Spring Boot 2.0, Prometheus, and Grafana (Part 2 — Exposing Metrics)
Follow this tutorial in order to learn how to expose metrics using Prometheus. This tutorial also includes pictures to aid in the tutorial.
Join the DZone community and get the full member experience.
Join For FreeIn part two, we will be enabling the metrics endpoints.
In the previous article, we created a REST API for CRUD operations on our entity. In this part, we will be working on the same application to add settings and configurations, which will enable us to expose endpoints for metrics.
As from Spring Boot 2.0, Micrometer is the default metrics export engine. Micrometer is an application metrics facade that supports numerous monitoring systems. Atlas, Datadog, Prometheus, etc. to name a few (as we will be using Prometheus in this tutorial, we will be focusing on Prometheus only).
When you add Spring Boot Actuator and micrometer as your dependencies, it auto-configures a composite MeterRegistry and adds a registry for each of the supported implementations that it finds on the classpath. Having a dependency on micrometer-registry-{system} in your runtime classpath is enough for Spring Boot to configure the registry.
- pom.xml : In pom.xml, add the dependency for micrometer-core and micrometer-prometheus-registry by adding following snippet.xml
<!-- Spring boot actuator to expose metrics endpoint -->
<dependency>
    <groupId>org.springframework.boot</groupId>
    <artifactId>spring-boot-starter-actuator</artifactId>
</dependency>
<!-- Micormeter core dependecy  -->
<dependency>
    <groupId>io.micrometer</groupId>
    <artifactId>micrometer-core</artifactId>
</dependency>
<!-- Micrometer Prometheus registry  -->
<dependency>
    <groupId>io.micrometer</groupId>
    <artifactId>micrometer-registry-prometheus</artifactId>
</dependency>- application.properties: unable the actuator and Prometheus endpoints to be exposed by adding below properties.proper
#Metrics related configurations
management.endpoint.metrics.enabled=true
management.endpoints.web.exposure.include=*
management.endpoint.prometheus.enabled=true
management.metrics.export.prometheus.enabled=true
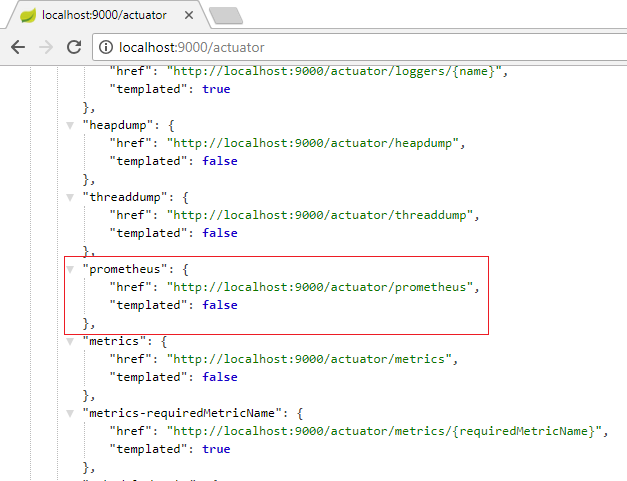
That is all you need to do to enable the metrics. Start the application with these changes and if you browse URL http://localhost:9000/actuator you should see the actuator endpoints.

Notice spring-boot 2 and actuator has enabled an endpoint http://localhost:9000/actuator/prometheus for us. If you browse this URL, you will be able to see the metrics exported from the person-application. The data is the actual metrics collected from the application and exported as JSON.

If you see something like above screenshot, then you have successfully exposed the metrics.
You can get the source code at this GitHub repository.
In next part, we will be setting up Prometheus and importing the metrics there.
Opinions expressed by DZone contributors are their own.

Comments