Monitoring Apache Ignite Cluster With Grafana (Part 1)
In this article, we cover the Grafana for monitoring Ignite clusters and provide step-by-step instructions to install and configure the entire stack technology.
Join the DZone community and get the full member experience.
Join For FreeApache Ignite is built on JVM and not a set-it-and-forget-it system. So, like other distributed systems, it requires monitoring for acting on time. However, Apache Ignite provides a web application named Ignite Web Console to manage and monitor the cluster, but it's not enough for system monitoring. You can also use JConsole/VisualVM for monitoring an individual Ignite node and a small number of Ignite nodes. Monitoring an Ignite cluster over 5 nodes by VisualVM or JConsole is unrealistic and time-consuming. Also, JMX does not provide any historical data. So, it is not recommended for production environments. Nowadays, there are a lot of tools/software available for system monitoring. The most famous of them are:
In this article, we cover the Grafana for monitoring Ignite clusters and provide step-by-step instructions to install and configure the entire stack technology.
Grafana is an open source graphical tool dedicated to query, visualize, and alert all your metrics. It brings your metrics together and lets you create graphs and dashboards based on data from various sources. Also, you can use Grafana to display data from different monitoring systems like Zabbix. It is lightweight, easy to install, easy to configure, and it looks beautiful.
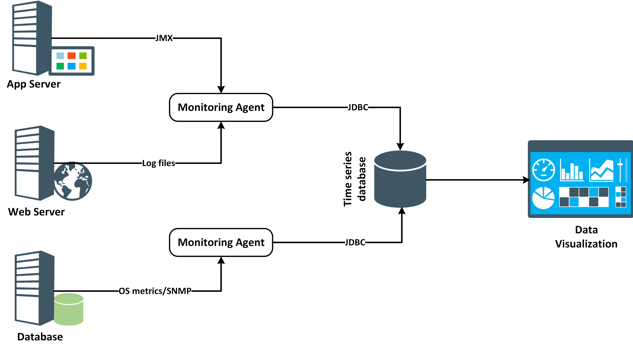
Before we dive into the details, let’s discuss the concept of monitoring large-scale production environments. Figure 1 illustrates a high-level overview of how the monitoring system looks in production environments.

In the above figure, data such as OS metrics, log files, and application metrics are gathering from various hosts through different protocols like JMX, SNMP into a single time-series database. Next, all the gathered data is used to display on a dashboard for real-time monitoring. However, a monitoring system could be complicated and vary in different environments.

Portions of this article were taken from the book The Apache Ignite book. If it got you interested, check out the rest of the book for more helpful information.
Let’s start at the bottom of the monitoring chain and work our way up. To avoid a complete lesson on monitoring, we will only cover the basics along with what the most common checks should be done as they relate to Ignite and it's operation. The data we are planning to use for monitoring are:
- Ignite node Java Heap.
- Ignite cluster topology version.
- Amount of server or client nodes in the cluster.
- Ignite node total up time.
The stack technologies we use for monitoring the Ignite cluster comprise three components: InfluxDB, Grafana, and jmxtrans. The high-level architecture of our monitoring system is shown in the figure below.

Ignite nodes does not send the MBeans metrics to the InfluxDB directly. We use jmxtrans, which collects the JMX metrics and send to the InfluxDB. Jmxtrans is lightweight and running as a daemon to collect the server metrics. InfluxDB is an open-source time series database developed by InfluxData. It is written in Go and optimized for fast, high-availability storage and retrieval of time series data in fields such as operations monitoring and application metrics.
Next, we install and configure InfluxDB, Grafana, and jmxtrans to collect metrics from the Ignite cluster. We also compose a custom dashboard in Grafana that monitors Ignite cluster resources.
Prerequisites. To follow the instruction to configure the monitoring infrastructure, you need the following:
Name |
Version |
OS |
MacOS, Windows, *nix |
InfluxDB |
1.7.1 |
Grafana |
5.4.0 |
jmxtrans |
271-SNAPSHOT |
Step 1. The data store for all the metrics from the Ignite cluster will be Influx. Let’s install the InfluxDB first. I am using MacOS, so I will use Homebrew to install InfluxDB. Please visit the InfluxDB website and follow the instructions to install for other operating systems like Windows or Linux.
brew install influxdbAfter completing the installation process, launch the database by using the following command:
influxd -config /usr/local/etc/influxdb.confInfluxDB running on http://localhost:8086 and provides REST API for manipulating the database objects by default. Also, InfluxDB provides a command line tool named influx to interact with the database. Execute the influx shell script on another console which starts the CLI and automatically connects to the local InfluxDB instance. The output should look as follows:
influx
Connected to http://localhost:8086 version v1.7.1 InfluxDB shell version: v1.7.1
Enter an InfluxQL query
A fresh install of InfluxDB has no database, so let’s create a database to store the Ignite metrics. Enter the following Influx Query Language (a.k.a InfluxQL) statement to create the database.
create database ignitesdbNow that the ignitesdb database is created, we can use the SHOW DATABASES statement to display all the existing databases.
show databases
name: databases name
----
_internal ignitesdb
Note that the _internal database is created and used by InfluxDB to store internal runtime metrics. To insert or query the database, use USE <db-name> statement, which will automatically set the database for all future requests. For example:
USE ignitesdb
Using database ignitesdb
That's enough for now. In the next part of this article, we will install and configure Grafana, jmxtrans to monitor the Ignite cluster. Stay tuned!
Opinions expressed by DZone contributors are their own.

Comments