Mobile Apps Dataset
This article includes a presentation of a new free mobile apps dataset. We also discuss how to create a CatBoost Model, complete with open-source datasets.
Join the DZone community and get the full member experience.
Join For FreeIntroduction
My main job is related to mobile advertising, and from time to time, I have to work with mobile application datasets.
I decided to make some of the data publicly available for those who want to practice building models or get an idea of some of the data that can be collected from open sources. I believe that open-source datasets are always useful as they allow you to learn and grow. Collecting data is often a difficult and dreary job, and not everyone has the ability to do it.
In this article, I will introduce a dataset and build one model using its data.
Data
The dataset is published on the Kaggle website.
DOI: 10.34740/KAGGLE/DSV/2107675.Stemmed description tokens and application data have been collected for 293392 applications (most popular). There are no application names in the dataset; unique IDs identifies them. Before tokenization, most of the descriptions were translated into English.
The dataset consists of four files:
- bundles_desc.csv — contains descriptions only;
- bundles_desc_tokens.csv — contains tokens and genres;
- bundles_prop.csv, bundles_summary.csv — сontain additional application characteristics and update dates.
EDA
First of all, let’s see how the data is distributed across operating systems.
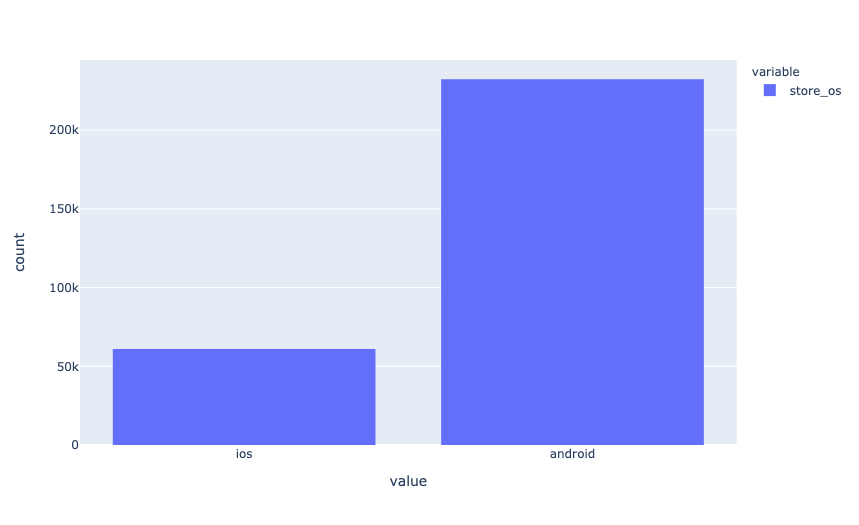
Android apps dominate in data. Most likely, this is because more applications for Android are being created. Considering that the dataset contains only the most popular applications, it is interesting to see how the release date is distributed.
histnorm='probability' # type of normalization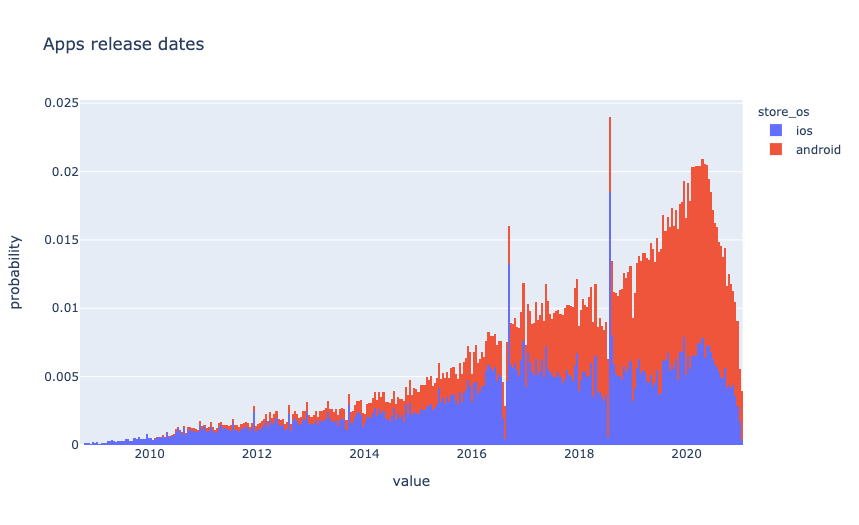
Most of the applications are updated regularly since the last update date is not far in the past.

Basic data was collected over a short period of time in January.
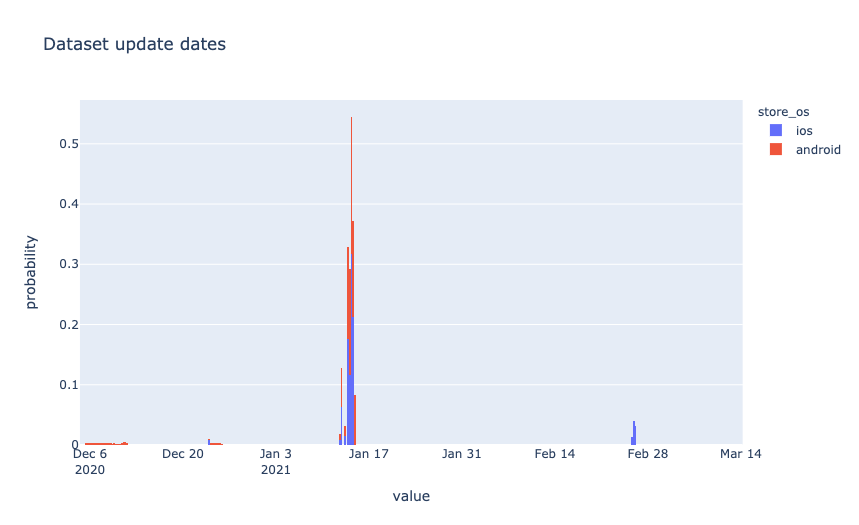
Let’s add a new feature — the number of months between the release date and the last update.
df['bundle_update_period'] = \
    (pd.to_datetime(
        df['bundle_updated_at'], utc=True).dt.tz_convert(None).dt.to_period('M').astype('int') -
     df['bundle_released_at'].dt.to_period('M').astype('int'))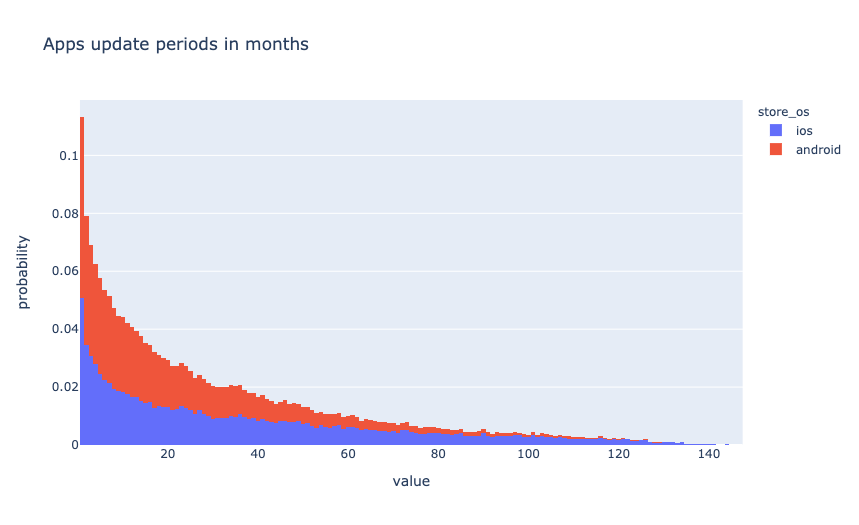
It is interesting to see how the genres are distributed. Taking into account the os imbalance, I will normalize the data for the histogram.
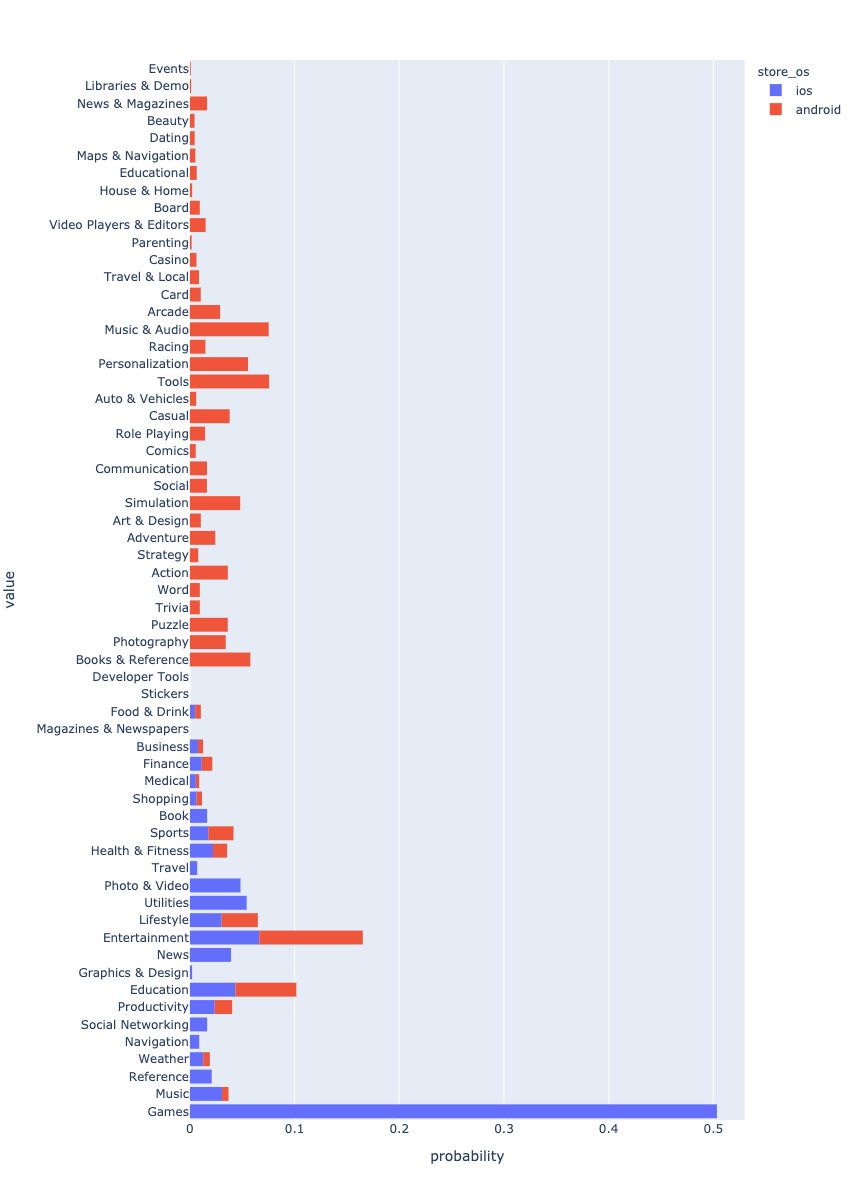
We can see that genres do not completely overlap. This is especially noticeable in games. Is there something we can do about it? The most obvious thing is to reduce the number of genres for Android and bring them to the same form as for iOS. But I suppose that this is not the best option, since there will be a loss of information. Let’s try to solve the inverse task. To do this, I need to build a model that can predict genres for iOS applications.
CatBoost Model
I created some additional features using the description length and the number of tokens.
def get_lengths(df, columns=['tokens', 'description']):
    lengths_df = pd.DataFrame()
    for i, c in enumerate(columns):
        lengths_df[f"{c}_len"] = df[c].apply(len)
        if i > 0:
            lengths_df[f"{c}_div"] = \
                lengths_df.iloc[:, i-1] / lengths_df.iloc[:, i]
            lengths_df[f"{c}_diff"] = \
                lengths_df.iloc[:, i-1] - lengths_df.iloc[:, i]
return lengths_dfdf = pd.concat([df, get_lengths(df)], axis=1, sort=False, copy=False)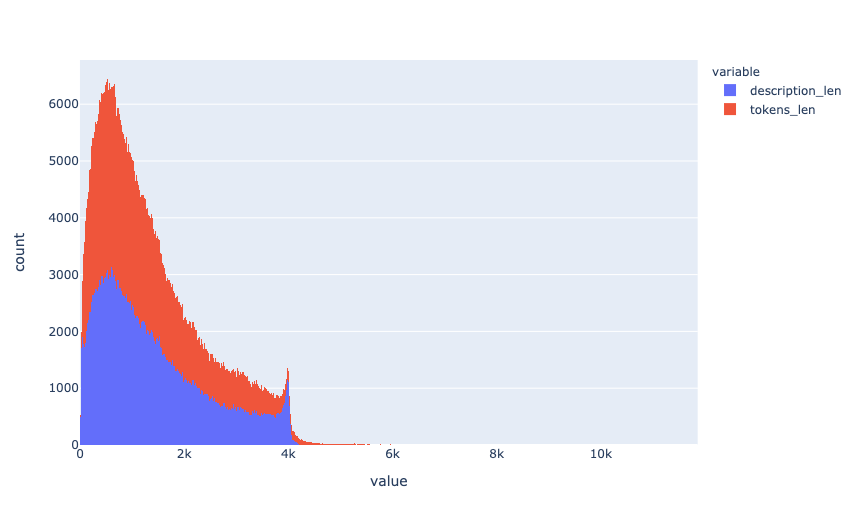
As one more feature, I took the number of months that have passed since the release date of the application. The idea is that there may have been some preference in the market for game genres.
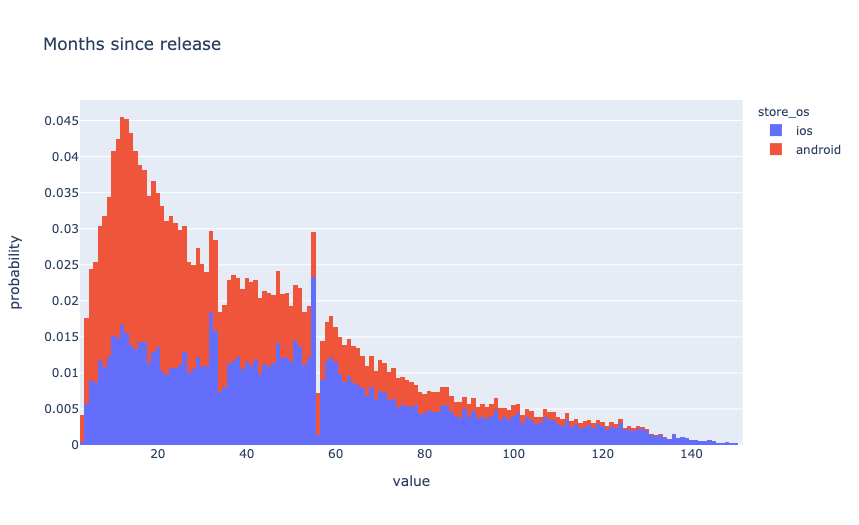
I used data from Android applications for training.
android_df = df[df['store_os']=='android']
ios_df = df[df['store_os']=='ios']
The final list of features for the model was as follows:
columns = [
    'genre', 'tokens', 'bundle_update_period', 'tokens_len',
    'description_len', 'description_div', 'description_diff',
    'description', 'rating', 'reviews', 'score',
    'released_at_month'
]
I divided the dataset with android applications into two parts — training and validation. Please note that splitting the dataset into folds should be stratified.
train_df, test_df = train_test_split(
android_df[columns], train_size=0.7, random_state=0, stratify=android_df['genre'])y_train, X_train = train_df['genre'], train_df.drop(['genre'], axis=1)
y_test, X_test = test_df['genre'], test_df.drop(['genre'], axis=1)I chose CatBoost as the free library for the model. CatBoost is a high-performance, open-source library for gradient boosting on decision trees. From release 0.19.1, it supports text features for classification on GPU out-of-the-box. The main advantage is that CatBoost can include categorical functions and text functions in your data without additional preprocessing.
In Unconventional Sentiment Analysis: BERT vs. Catboost, I give an example of how CatBoost works with text and compared it with BERT.
!pip install catboostWhen working with CatBoost, I recommend using Pool. It is a convenience wrapper combining features, labels, and further metadata like categorical and text features.
train_pool = Pool(
    data=X_train,
    label=y_train,
    text_features=['tokens', 'description']
)test_pool = Pool(
data=X_test,
label=y_test,
text_features=['tokens', 'description']
)Let’s write a function to initialize and train the model. I didn’t select the optimal parameters; let that be your other homework.
def fit_model(train_pool, test_pool, **kwargs):
    model = CatBoostClassifier(
        random_seed=0,
        task_type='GPU',
        iterations=10000,
        learning_rate=0.1,
        eval_metric='Accuracy',
        od_type='Iter',
        od_wait=500,
        **kwargs
)return model.fit(
train_pool,
eval_set=test_pool,
verbose=1000,
plot=True,
use_best_model=True
)Text features are used to build new numeric features. But for this, it is necessary to explain to CatBoost what exactly we want to get from it.
CatBoostClassifier has several parameters which can be used for parameterization:
- tokenizers — tokenizers used to preprocess Text type feature columns before creating the dictionary;
- dictionaries — dictionaries used to preprocess Text type feature columns;
- feature_calcers — feature calcers used to calculate new features based on preprocessed Text type feature columns;
- text_processing — a JSON specification of tokenizers, dictionaries, and feature calcers, which determine how text features are converted into a list of float features.
The fourth parameter replaces the first three and, in my opinion, is the most convenient, since in one place, it is clearly indicated how to work with the text.
tpo = {
    'tokenizers': [
        {
            'tokenizer_id': 'Sense',
            'separator_type': 'BySense',
        }
    ],
    'dictionaries': [
        {
            'dictionary_id': 'Word',
            'token_level_type': 'Word',
            'occurrence_lower_bound': '10'
        },
        {
            'dictionary_id': 'Bigram',
            'token_level_type': 'Word',
            'gram_order': '2',
            'occurrence_lower_bound': '10'
        },
        {
            'dictionary_id': 'Trigram',
            'token_level_type': 'Word',
            'gram_order': '3',
            'occurrence_lower_bound': '10'
        },
    ],
    'feature_processing': {
        '0': [
            {
                'tokenizers_names': ['Sense'],
                'dictionaries_names': ['Word'],
                'feature_calcers': ['BoW']
            },
            {
                'tokenizers_names': ['Sense'],
                'dictionaries_names': ['Bigram', 'Trigram'],
                'feature_calcers': ['BoW']
            },
        ],
        '1': [
            {
                'tokenizers_names': ['Sense'],
                'dictionaries_names': ['Word'],
                'feature_calcers': ['BoW', 'BM25']
            },
            {
                'tokenizers_names': ['Sense'],
                'dictionaries_names': ['Bigram', 'Trigram'],
                'feature_calcers': ['BoW']
            },
        ]
    }
}
Let’s train the model:
model_catboost = fit_model(
    train_pool, test_pool,
    text_processing = tpo
)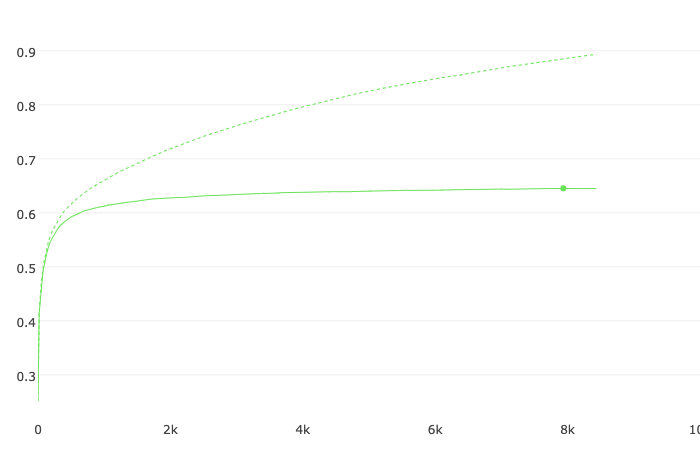
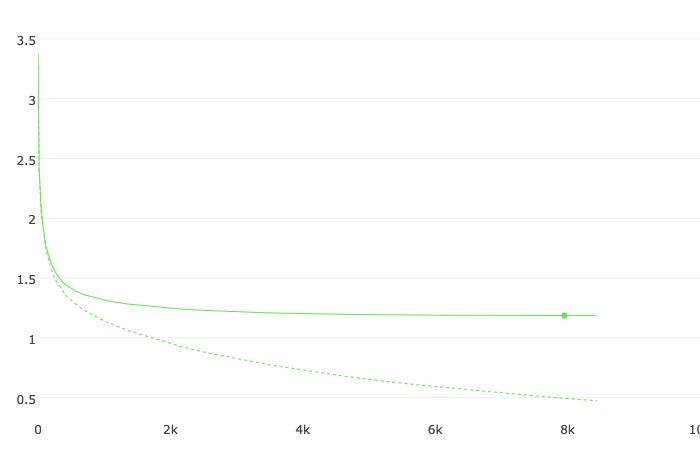
bestTest = 0.6454657601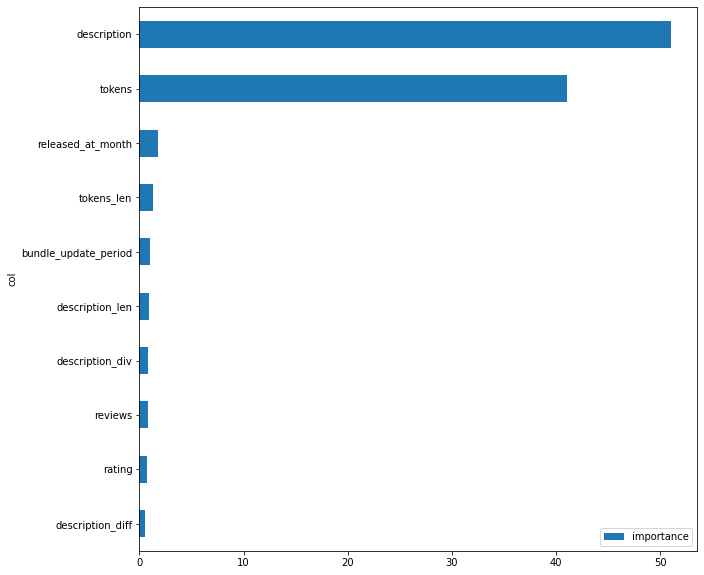
Only two features have a major impact on the model. Most likely, the quality can be increased due to the summary feature, but since it is not available in iOS applications, it will not be possible to apply it quickly. It would help if you had a model that can get a short paragraph of text from the description. I’ll leave this task as your homework.
Judging by the numbers, the quality is not very high. The main reason is that applications are often challenging to attribute to one specific genre, and when specifying the genre, the developer bias is present. A more objective feature is needed that reflects several of the most appropriate genres for each application. Such a feature can be the vector of probabilities, where each element of the vector corresponds to the probability of attribution to one or another genre.
To get such a vector, we need to complicate the process using OOF (Out-of-Fold) predictions. We will not use third-party libraries; let’s try to write a simple function.
def get_oof(n_folds, x_train, y, x_test, text_features, seeds):

    ntrain = x_train.shape[0]
    ntest = x_test.shape[0]

    oof_train = np.zeros((len(seeds), ntrain, 48))
    oof_test = np.zeros((ntest, 48))
    oof_test_skf = np.empty((len(seeds), n_folds, ntest, 48))
    test_pool = Pool(data=x_test, text_features=text_features)
    models = {}
    for iseed, seed in enumerate(seeds):
        kf = StratifiedKFold(
            n_splits=n_folds,
            shuffle=True,
            random_state=seed)
        for i, (tr_i, t_i) in enumerate(kf.split(x_train, y)):
            print(f'\nSeed {seed}, Fold {i}')
            x_tr = x_train.iloc[tr_i, :]
            y_tr = y[tr_i]
            x_te = x_train.iloc[t_i, :]
            y_te = y[t_i]
            train_pool = Pool(
                data=x_tr, label=y_tr, text_features=text_features)
            valid_pool = Pool(
                data=x_te, label=y_te, text_features=text_features)
            model = fit_model(
                train_pool, valid_pool,
                random_seed=seed,
                text_processing = tpo
            )
            x_te_pool = Pool(
                data=x_te, text_features=text_features)
            oof_train[iseed, t_i, :] = \
                model.predict_proba(x_te_pool)
            oof_test_skf[iseed, i, :, :] = \
                model.predict_proba(test_pool)
            models[(seed, i)] = model
    oof_test[:, :] = oof_test_skf.mean(axis=1).mean(axis=0)
    oof_train = oof_train.mean(axis=0)
    return oof_train, oof_test, models
The calculations are very time consuming, but as a result, I got:
- oof_train — OOF-predictions for Android apps
- oof_test — OOF-predictions for iOS apps
- models — all OOF-models for folds and random seeds
from sklearn.metrics import accuracy_scoreaccuracy_score(
android_df['genre'].values,
np.take(models[(0,0)].classes_, oof_train.argmax(axis=1)))Due to folding and averaging over several random seeds, the quality has improved a little bit.
OOF accuracy: 0.6560790777135628I created a new feature, android_genre_vec, into which I copied the values from the oof_train for Android applications and the oof_test for iOS applications.
idx = df[df['store_os']=='ios'].index
df.loc[df['store_os']=='ios', 'android_genre_vec'] = \
    pd.Series(list(oof_test), index=idx)
idx = df[df['store_os']=='android'].index
df.loc[df['store_os']=='android', 'android_genre_vec'] = \
    pd.Series(list(oof_train), index=idx)
Additionally, android_genre was also added, in which I put the genre with maximum probability.
df.loc[df['store_os']=='ios', 'android_genre'] = \
    np.take(models[(0,0)].classes_, oof_test.argmax(axis=1))
df.loc[df['store_os']=='android', 'android_genre'] = \
    np.take(models[(0,0)].classes_, oof_train.argmax(axis=1))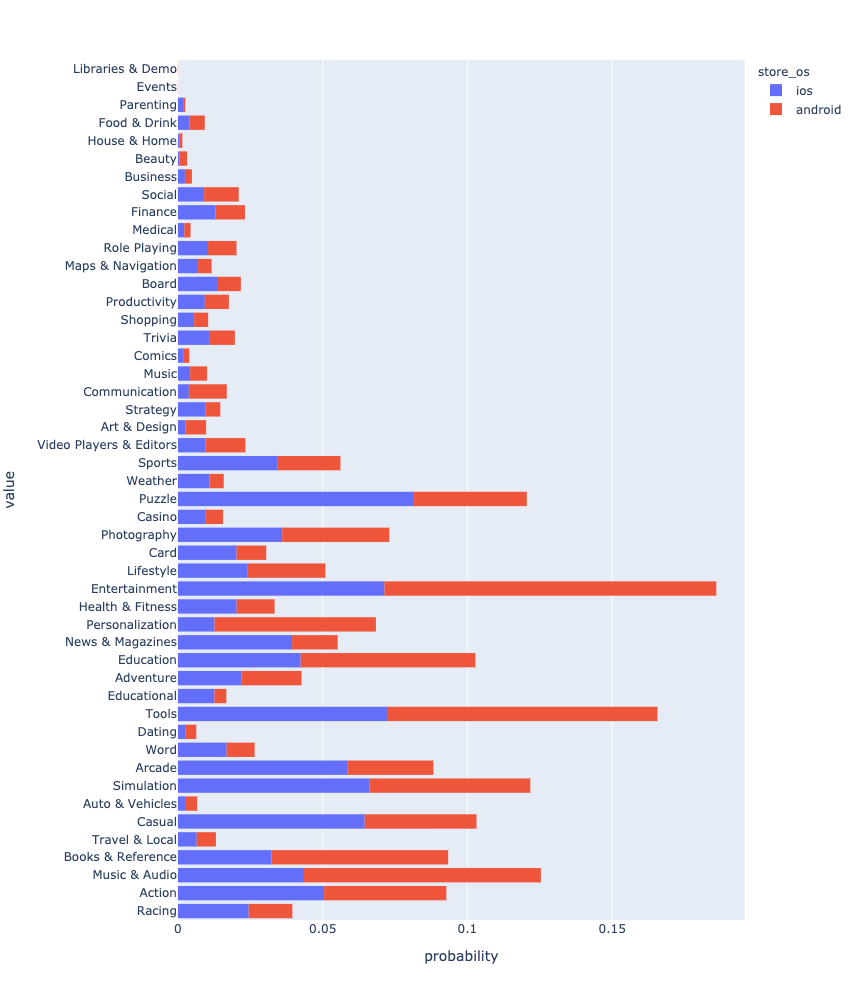
Summary
In this article, I:
- introduced a new free dataset;
- did exploratory data analysis;
- created several new features;
- created a model to predict the genre of an application from its description.
I hope that this dataset will be useful to the community and used in both models and research.
The code from the article can be viewed here.
Opinions expressed by DZone contributors are their own.

Comments