Making the Leap From Old-School Monitoring to Modern O11y
Modern observability techniques and tools have finally provided IT practitioners with the ability to attain the point of view of the application we always wanted.
Join the DZone community and get the full member experience.
Join For FreeThe term "old-school" has two decidedly different meanings. On the one hand, it can mean classically trendy, something that never went (or will go) out of style. On the other, it connotes something that's outdated, outmoded, and fairly irrelevant.
I cut my teeth on ping and SNMP, so — while it pains me to say this — old-school monitoring is decidedly in the latter category. Back in the day, if the experience your company was providing, I’ll call this a service, could be measured, it was not easy to do. You were left trying to infer user experience based on data from parts of the service as a whole. It included measuring CPU, RAM, and database metrics and hoping that those metrics reflected enough to tell whether your service was truly working for your customers. With this “old school” way of thinking, enough tangential insight could add up to a full picture of a user's actual experience.
The problem with that approach is that it doesn’t provide a complete picture. In this blog post, I’ll show you how to reframe your thinking, so you can better understand how to move towards modern and more complete observability.
New Days, New Ways of Monitoring
"That's how we've always done it" is never an excuse for not improving or adapting to what's possible with monitoring and observability today.
As a reminder, one of the hallmarks of observability is the ability to understand the internal operation of a system from its external outputs. A system that's "observable" will tell you how it's doing without you needing to ask. This sums up one of the functional differences between old-school monitoring and modern observability: monitoring is the act of repeatedly asking a system about its current state. Observability, on the other hand, means the system outputs its current state as a part of its normal operation rather than as an interruption.
Better still, it's never been easier to instrument applications for observability. Whether the output is metrics, events, logs, or traces, modern observability solutions offer a variety of methods to snap into existing code, from APIs to agents, allowing you the freedom to incorporate and extend observability to best fit your needs.
Before assuming I'm trying to say so-called old-school metrics are no longer needed, I want to emphatically state that this is a both-and rather than an either-or situation. Those low-level data points are not only helpful, but they're also necessary.
If a drive within a SAN array begins throwing errors (a fault that could progress over a period of weeks before it completely fails), traces and user experience monitoring will never reveal the root cause. Likewise, the "view from the top" might not differentiate between the SAN issue and a problem in a memory module of a network device, a corrupt driver on a server, or even a misconfiguration in an image file that's used by the container orchestration system. For this kind of insight, all those traditional monitoring techniques and technologies are still needed.
Examples in Observability
What does that look like in real-world terms? Let’s take a look.
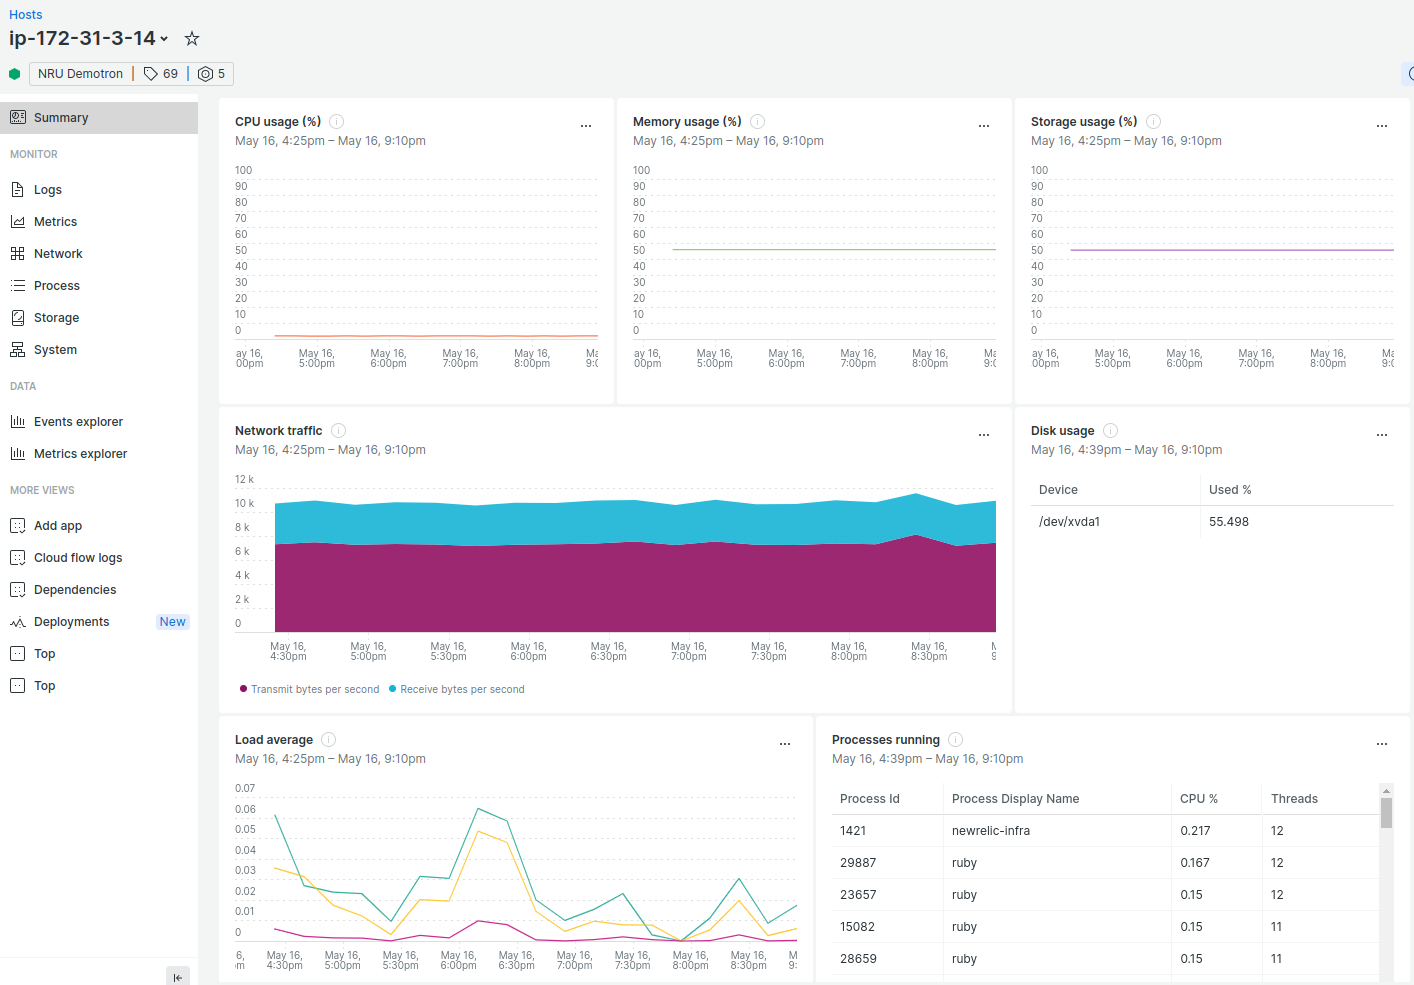
You suspect the WebPortal application in this next example is experiencing an issue, such as an uptick in customer calls. You need to understand what’s really happening in production without running a fake routine every five minutes from a single location. The next logical step is to turn to our tools and see what might be happening:

While you can see that the load average may have “spiked” a little higher than normal, at 0.06, that’s not anywhere near critical. Meanwhile, all the other stats have remained flat.
Even a few years ago, this is where problem-solving would start. Limited to just this data set, there’s really no telling what the problem may be.
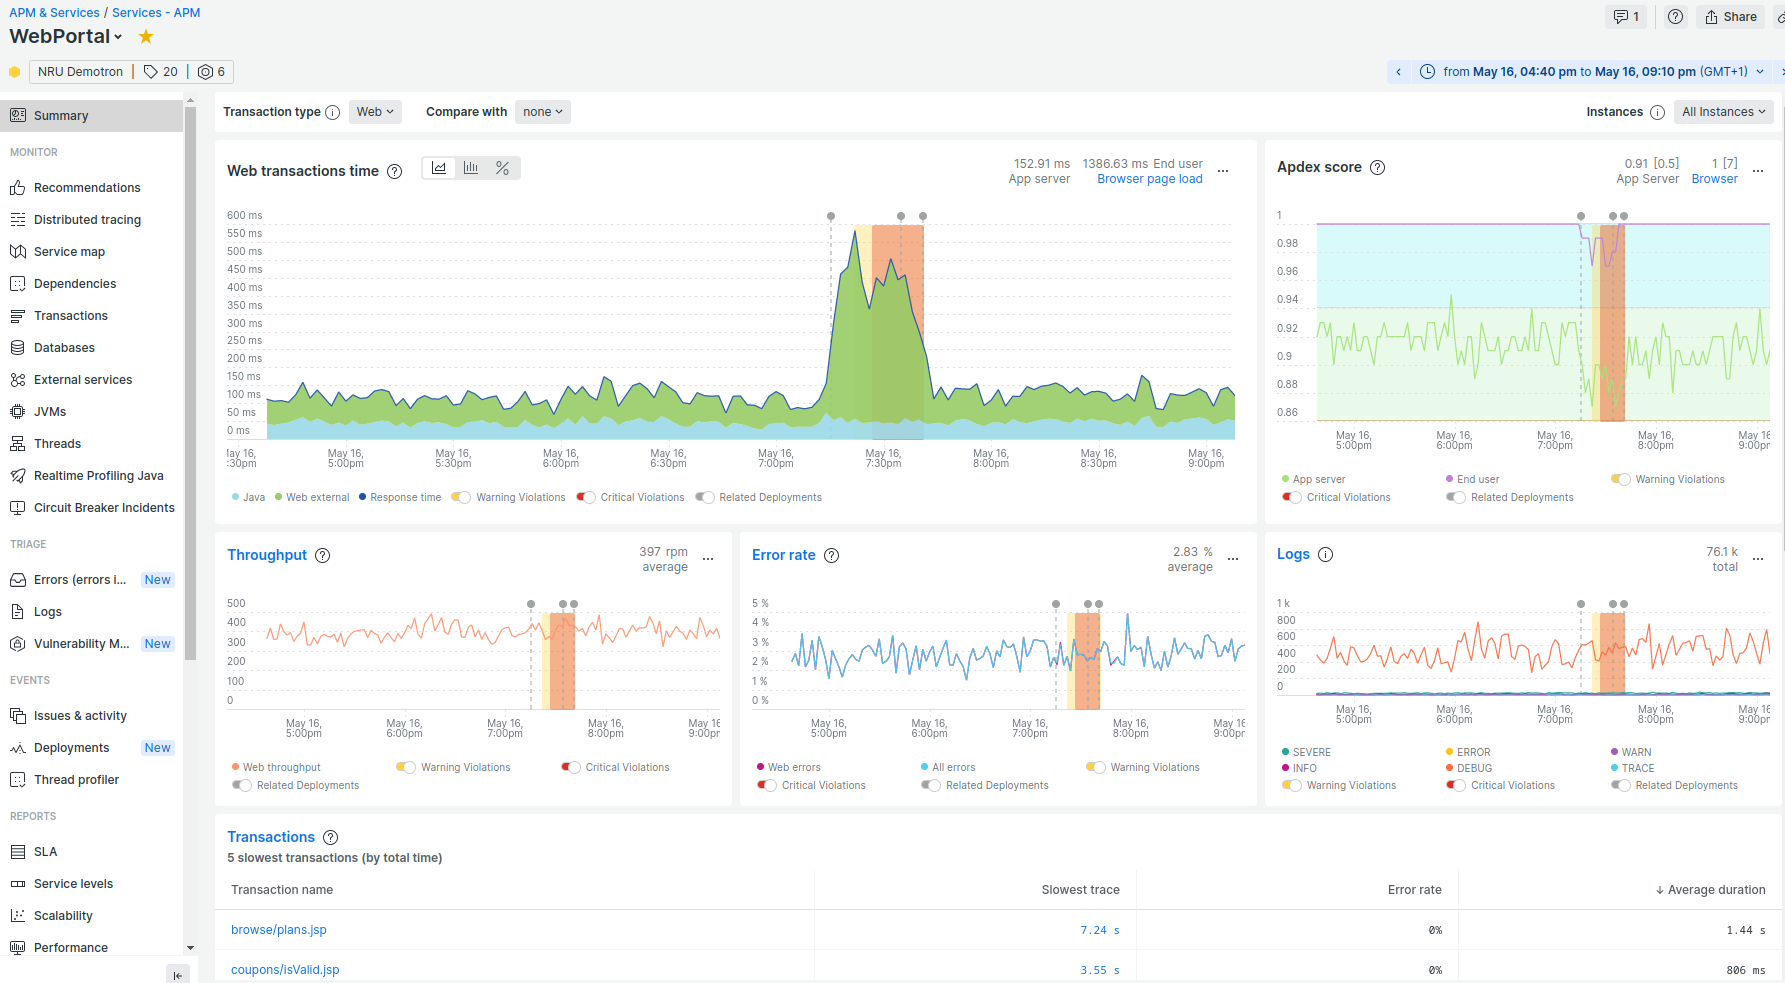
But now, robust tools support more telemetry options than just metrics. Application tracing is the act of collecting information on how your code is running for real users in the environment as it is happening. And having that in your suite of tools allows you to see this:

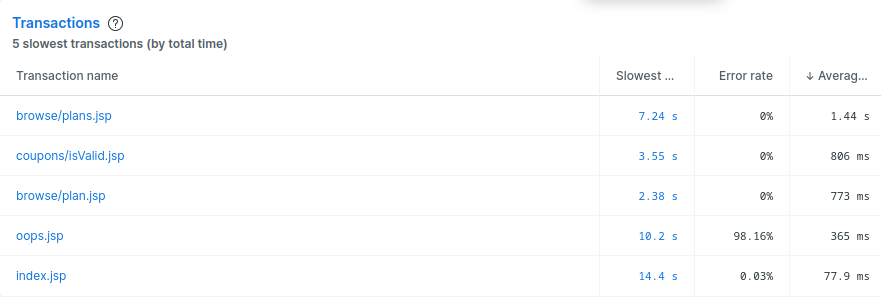
With this assistance, it’s easy to see what happened and when and even get an idea of why. Those little gray dots? Those are “deployment markers” and then show when the code was changed and deployed to production. The telemetry from traces is granular, meaningful, and specific, which allows us to dig even further and look at the specific transactions:

From here, you can decide whether to investigate the browse/plans.jsp transaction, which is an eye-watering seven seconds or the appropriately named oops.jsp with its 98.16% error rate.
But the point of showing you this isn’t to teach you the specifics of application performance monitoring (APM). It’s to illustrate the way that real-time performance metrics completely change the way you can identify and investigate problems in your applications.
That doesn’t mean that metrics go out the window. As stated before, the problem could just have easily been with a bad stick of RAM or a corrupt database table. It just means you allow the customer experience — as visualized by APM and traces — to take priority and frame the moments when you might need to dig deeper.
When, Not If
What has changed, then, isn't if you need traditional monitoring or observability techniques but when to use them.
At its heart, monitoring, and observability is the consistent collection of telemetry from a set of entities. Everything else — alerts, reports, dashboards, and the like — is simply a happy byproduct of gathering the telemetry in the first place.
So, if you're still collecting all the data, what has to change in order to go from old-school monitoring to modern observability? In a word, "perspective."
The leap to modern observability doesn't require that we give up our old tools but instead give up our old perspective and way of thinking. Start by measuring what matters: the experience of the people using the service. A failure at that level is a "real" failure and requires an immediate response.
That response can include automation which might look like increasing the resources available or re-deploying a container with the latest code. If those automated responses don't resolve the issue, that's when people need to get directly involved.
Now, this is when lower-level information becomes essential. Because once all the standard, easily-automated responses have been done, it's almost certain that the problem lies deeper in the stack. But collecting data after a problem has started is obviously ineffective. The data has to be collected all along.
How To Achieve a Modern Observability Solution
“OK, I’m convinced, but how do I get there? Do I have to throw out everything I have and build a modern observability solution from the ground up?” I hear you asking. Thankfully, no.
Although you should add observability to your current monitoring solutions, having tools that do the same thing can waste time, focus, or money. I suggest you consider a process that has the following milestones:
- Add observability capabilities.
- Integrate your tools.
- Simplify your inputs.
Add Observability Capabilities
Identify the elements of modern observability that are missing from your environment—whether that means the capability is completely missing or possible but with an unacceptable cost (in time, effort, or actual money).
This is the point in the process to be rational about what you need but also thoughtful about what the future holds. It is much harder to bolt on an overlooked-but-critical capability later than it is to select a solution that has both what you need now and what you are likely to grow into later.
For example, if you aren’t specifically shopping for something that uses machine learning to identify probable root causes by combining metrics, logs, events, and traces, you’d have a hard time convincing me I’ll never need something like that.
Once you’ve selected a tool, get it installed and operational, and train your entire team on its capabilities, operation, and maintenance. This includes finding out where the new solution blends most naturally with your organization’s priorities. Finding those natural synergies is the best way to ensure some early wins and establish the value of the new tool.
Integrate Your Tools
After you’ve installed your solution, it’s time to stop playing “dashboard whack-a-mole” with a half dozen screens showing disparate data. Instead, integrate everything together. I’m going to be really prescriptive here and tell you that trying to get your new observability solution’s data into your (old) existing monitoring tools is the wrong choice.
Robust, modern observability solutions have multiple ways to ingest data, including tool- and language-specific agents, data connectors, custom integration, and APIs. No matter what monitoring tools you’re using, there’s very likely a way to display that data alongside your observability telemetry.
The benefit of doing this is that you can view both high and low levels of information side by side, in context with each other. This provides the next step in the path to being able to start with the view of customer experience and then move organically to view systems and infrastructure data as needed.
Simplify Your Inputs
On the final leg of your journey to peak observability, consider removing redundant inputs. Yes, that means it might be time to say goodbye to some cherished old tools. But the truth is that modern observability solutions can usually cover the lower levels as well.
At this stage, you and your team should be very familiar with your observability tool’s capabilities and which overlaps are sufficient for your needs. So, now is the time to start migrating, rather than integrating, to use the new tool’s functions.
This is also a good time to step back and ask yourself which of the old-school data sets are still needed. Does your organization need network packet information now that you can see how customers are interacting with the application? Those, and, likely, many others, maybe metrics you can bid a fond farewell to.
Looking Ahead Without Forgetting the Past
Modern observability means putting the user's experience where it belongs: first and foremost. That includes understanding and setting the correct expectations for what the user experience ought to be. If the experience falls short, that's when additional insight is brought to bear.
Modern observability techniques and tools have finally provided IT practitioners with the ability to attain the point of view of the application we always wanted. Now our job is to shift our perspective without losing sight of all the things we learned on the journey to the peak.
Published at DZone with permission of Leon Adato. See the original article here.
Opinions expressed by DZone contributors are their own.

Comments