Machine Learning Algorithms: Mathematics Behind Linear Regression
In this article, we explain the real mathematics behind linear regression algorithm in machine learning.
Join the DZone community and get the full member experience.
Join For FreeThere are several machine learning algorithms that can provide the desired outputs by processing the input data. One of the widely used algorithms is linear regression.
Linear regression is a type of supervised learning algorithm where the output is in a continuous range and isn’t classified into categories. Through a linear regression machine learning algorithm, we can predict values with a constant slope.
What Is Linear Regression Used For?
The most popular uses of linear regression in a machine learning system is predictive analytics and modeling. With the help of linear regression, we can quantify the relationship between the predictor variable and an output variable.
For example, We can quantify the impact of advertising on sales in a business, demographics on location tracking, age on height, and many more.
Linear regression is used in machine learning solutions to predict the future values. It is also known as multiple regression, multivariate regression, and ordinarily least squares.
There are various blogs explaining how to perform linear regression on various datasets. However, there are only a few articles explaining the mathematical formulae used in the backend when we use the linear regression classifier of sklearn (python library) or other libraries.
Here we will dive deep into the mathematics of linear regression.
Supervised Learning:
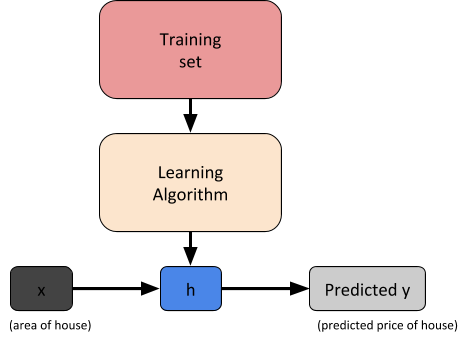
We are taking a simple example of a dataset having some values of houses as per their areas.

As you can see in our machine learning algorithm dataset, we have some value for areas and their respective prices, let’s say our input parameter x is Area and our output parameter y is Price.
When we have fixed output parameter y and input parameter x, this type of learning is called supervised learning.
So for a given machine learning training dataset, our goal is to learn a function h:x y so that h(x) is a prediction value for the corresponding value of y.
Function h is known as hypothesis.

Regression Problem:
When the target variable that we are trying to predict is continuous such as in our housing price prediction example, we call this learning problem a regression problem.
Classification Problem:
When y can take only a small number of discrete values we call it a classification problem.
Linear Regression:
Linear regression is a supervised learning algorithm in machine learning solutions used when the target / dependent variable continues in real numbers.
It establishes a relationship between dependent variable y and one or more independent variable x using the best fit line. It works on the principle of ordinary least square (OLS) / Mean square error (MSE).
In statistics OLS is a method to estimate unknown parameters of linear regression function, it’s goal is to minimize the sum of square differences between observed dependent variables in the given data set and those predicted by linear regression function.
We have three methods to draw the best fit line for linear regression.
- Batch Gradient descent
- Stochastic Gradient descent
- Normal equation
Lets make our dataset a little more richer to understand the concept in a broader manner.

According to our hypothesis our equation will be:

Now before jumping into example and cost function let us make several notations.

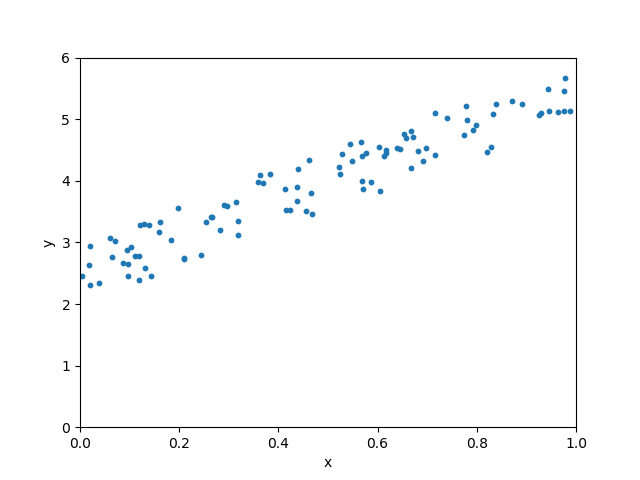
Let’s take some random values of x and y to train our model.
<script src="https://gist.github.com/pranavbtc/1b4c1be1c8ebba96d844919afd7ac15a.js"></script>
Below scatter plot shows relationship between x and y.

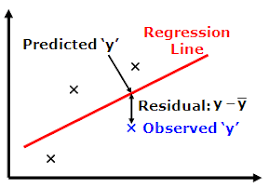
To decide whether our line is best fitted or not we will define a cost function.
The error between predicted values and observed values is called residuals, and our cost function is nothing but the sum of squares of residuals.

Cost function is denoted by:

The linear regression algorithm in machine learning models passes through 1000s of iterations before arriving on a set of weights used to make the predictions. These iterations train the model to generate the desired output every time we input the predictor variable into the equation.
Conclusion: Mathematics for Machine Learning
Linear regression is the most basic type of machine learning algorithm used to predict the relationship between two variables. The factor being predicted is called the dependent variable as it requires the input variable for reaching that value.
One of the widely popular use cases of linear regression is in forecasting the sales of any company. Companies that have steady sales increase or decrease over the past few months can predict the future trend using this machine learning algorithm.
Today, more and more businesses are trying to eliminate uncertainty by utilizing machine learning models that make near accurate predictions. Machine learning as a service is widely used by enterprises of all kinds and industries to forecast demand, supply, estimate market trends, income, expenses, and even the overall growth.
In the next blog, we will try to do hands-on training using our first method Gradient Descent with the help of numpy library, we will also see the result of scikit learn library for the same above dataset.
Enjoy learning with machines!
Published at DZone with permission of Shardul Bhatt. See the original article here.
Opinions expressed by DZone contributors are their own.

Comments