Learn How to Perform Load Testing in Elasticsearch
In this article, we will take a look at how to create and run a load test on Elasticsearch with Apache JMeter. Read on to get started!
Join the DZone community and get the full member experience.
Join For FreeIn this article, we will learn to create and run a load test on Elasticsearch with Apache JMeter™. We will create a search request and monitor the results, the relevance of results and the errors if there are any. We will also mention the most common problems that can be identified by means of stress testing.
Elasticsearch is a search engine based on Apache Lucene. It is almost completely managed via HTTP requests by using JSON objects. This means that any actions with Elasticsearch can be conducted via HTTP requests with a JSON object in the body of the request. For example, we can configure indexes, add documents, search documents, manage clusters, etc.
This engine and similar ones, for instance, Solar and Sphinx, are used for complex searches in documents databases. For instance, a search that is related to the morphology of the language, geo-coordinates searching or just searching a large number of parameters in documents.
Before starting, as usual, we will explain some of the definitions we will need for our work:
- Node - an Elasticsearch process running on the server. Each node has its own configuration in the cluster.
- Cluster - several nodes connected together by a cluster name. A single node can also be a cluster. Each cluster has a single master node that is chosen automatically by the cluster and that can be replaced in case the current master node fails.
- Index - a set of documents for searching through. An index can contain different types of documents.
- Shard - a part of the index. Indexes are divided to distribute requests between servers.
- Replica - a copy of the shard. Each shard is stored in multiple copies (optional) on different servers to improve availability and performance.
- Document - a JSON object that is stored in Elasticsearch.
For a better understanding, please read the glossary. Now let's get started.
1. To create a demo scenario to test, we have deployed Elasticsearch in Heroku with the Bonsai add-on for our convenience. We used the following test data, which simulates bank accounts.
2. As was written earlier, Elasticsearch is almost completely managed via HTTP. For example, to create an index, we must send a PUT request and specify the index name after '/' in the address bar.

After doing that, the server will respond that the index was created. Or, when that is not the case, it will report an error.
3. If you want to add multiple documents to Elasticsearch, you need to send a POST request to the address '../{index}/{datatype}/_bulk?pretty', and specify the data in the request body as JSON objects.
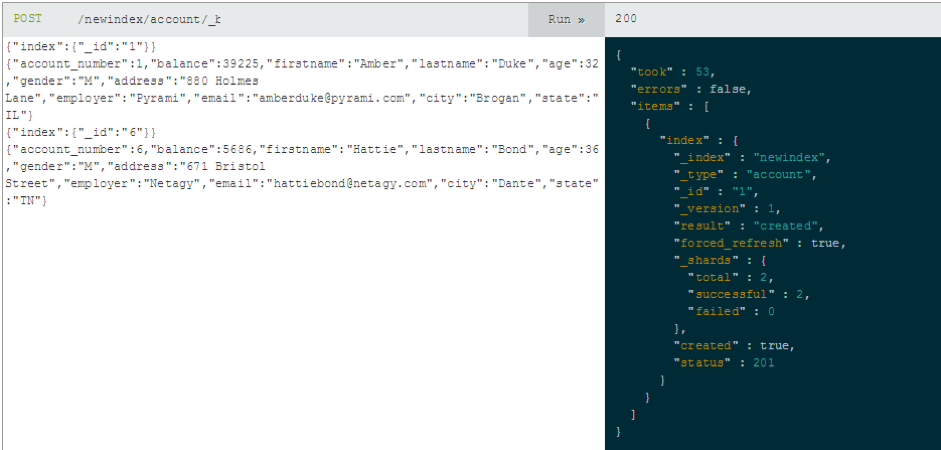
The server will report the result of the operation by returning a corresponding JSON object.
4. You can view all indexes by sending a GET request to the address '_cat / indices?v'.

5. In the end, the search is performed by sending the '_search' command with parameters to the required address using the GET method. For example, this request will display all accounts from the state of Virginia: '/newbank/account/_search?q =state:VA&pretty'.
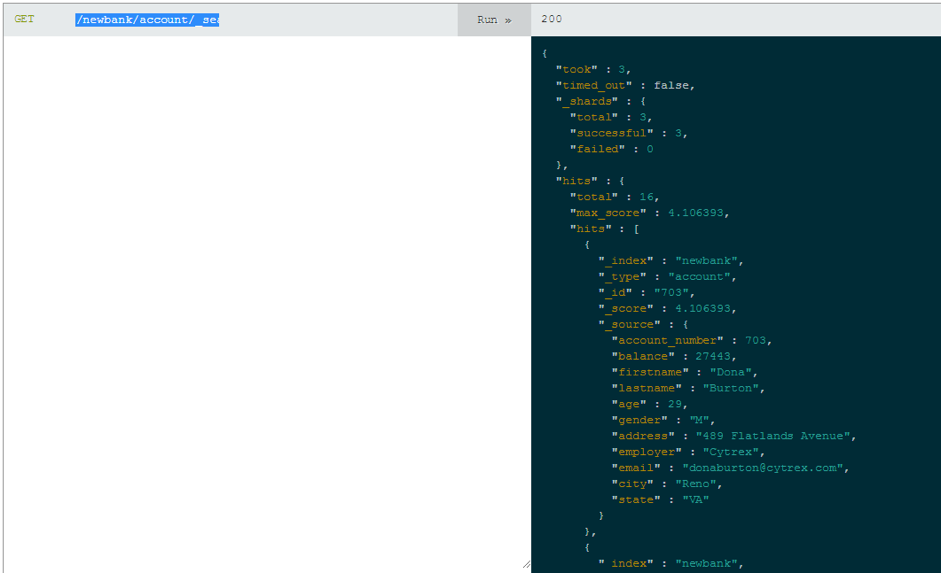
6. As a result, we have the following configuration: a 'newbank' index with 999 documents of 'account' type. The settings for the index are 3 shards and 2 replicas. We also have 3 nodes in the cluster, so we have 9 shards.
We sent the requests through the Bonsai.io interface. You can use the Curl utility or browser plugins like Elasticsearch Head or full web admin tools like Cerebro for request testing. Some of them, Marvel and Cerebro for example, allow you to monitor the state of the nodes and other internal metrics of the cluster.
Testing a Search Request
Elasticsearch communication is conducted through HTTP requests. Therefore, we do not need to install any JMeter plugins to test Elasticsearch. All we need is the HTTP Request Sampler. So let's add it and reproduce the search request that we made earlier.
Right click on Thread Group-> Add-> Sampler-> HTTP Request Sampler
- Server Name or IP is the address of the ES.
- Path is our path, that contains the index, type and search request.
- Method is set GET.
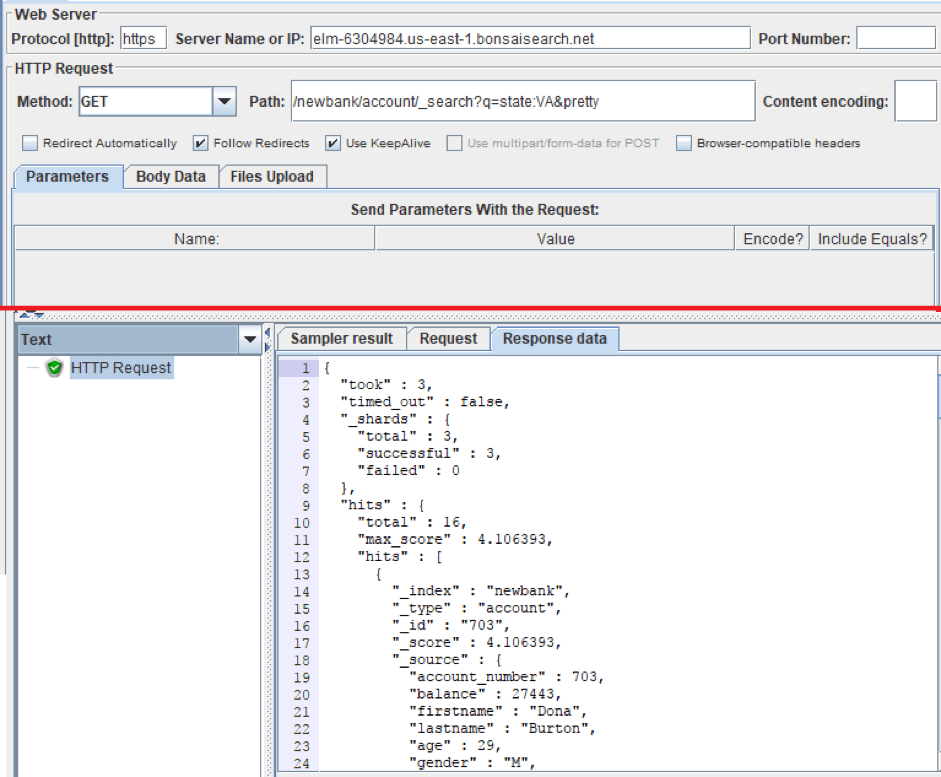
As you can see in the screenshot, we received the same JSON as in the demonstration above.
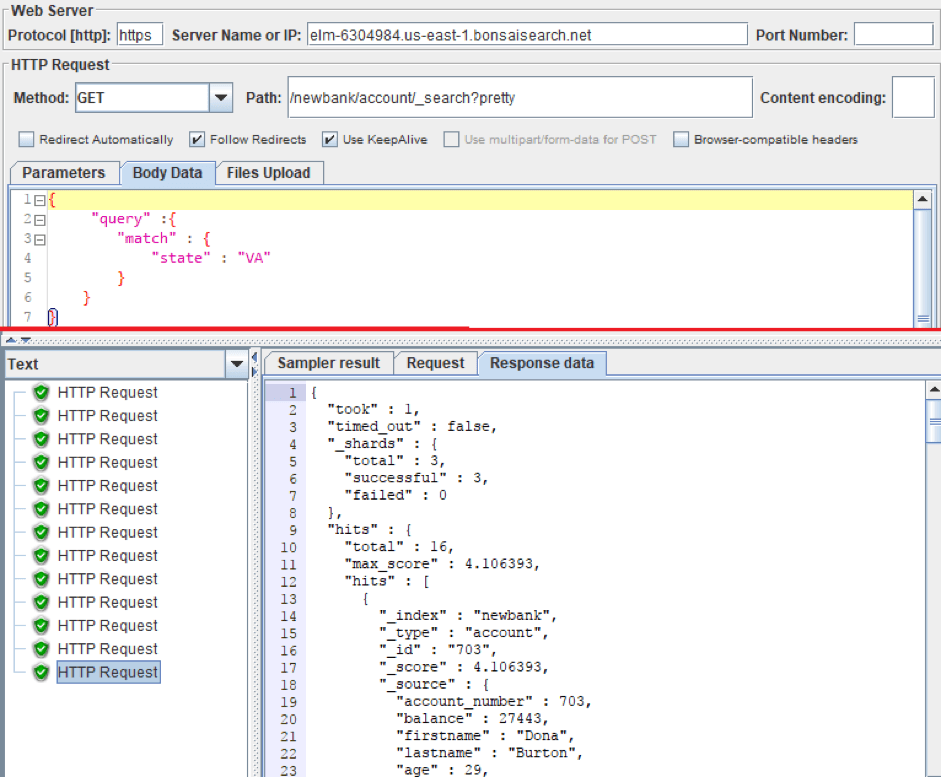
A search request can also be described as a JSON object. Thanks to that, HTTP Requests have great opportunities for customization. By using the JSON object we can construct more precise and more functional search requests. Accordingly, the structure of the requests affects the performance of the system: the more parameters the request contains, the more operations the ES will perform.
To paste a JSON object into an HTTP request you need to switch the Parameters tab to the Body Data tab. The request method still stays GET despite the body of the request.
Let's repeat the previous request for finding all accounts in the state of Virginia. Only this time, we added body data.
Testing Adding Documents
If you also need to check adding documents, you can use the json-generator or mockaroo in your tests, to get test data. To place the received data in the request body, you can use the CSV Data Set Config. Create a CSV file with test data, then configure the CSV Data Set Config for data extraction from the file to JMeter Variables. Finally, put the JMeter Variables into the body of an HTTP request.
Advanced Testing With Functions
In addition, you can generate test data using standard JMeter functions and Сustom JMeter functions, which can be installed via the JMeter Plugin Manager.
To view the standard functions, you can use Function Helper Dialog. In this window, you can see all standard functions of JMeter, their parameters and you can test them.
Go to Options (Top menu) -> Function Helper Dialog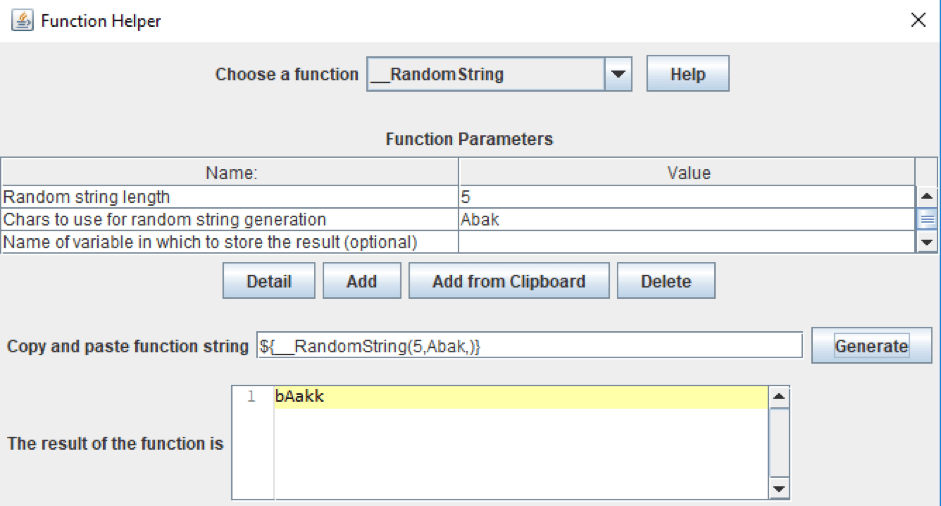
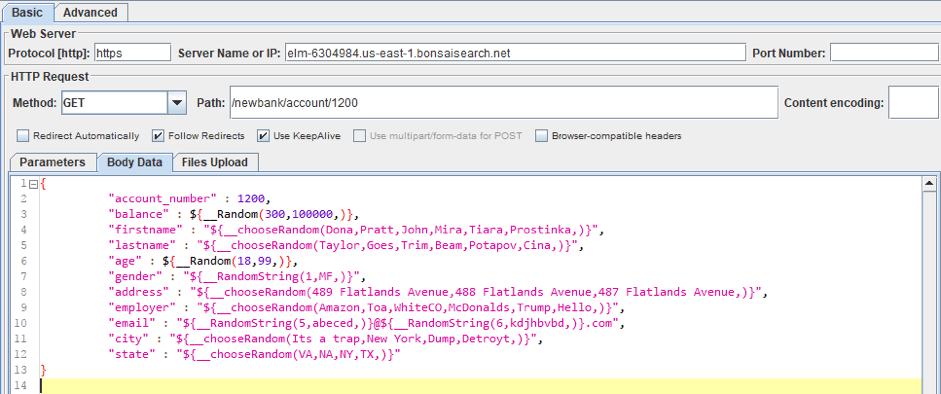
For instance, we made a template for the request to create a document that contains information about the user's bank account. We used the standard functions to get random strings and numbers. From Custom JMeter functions, we used _сhooseRandom that selects a random value from the set. You can see the whole template in the screenshot and text box below.
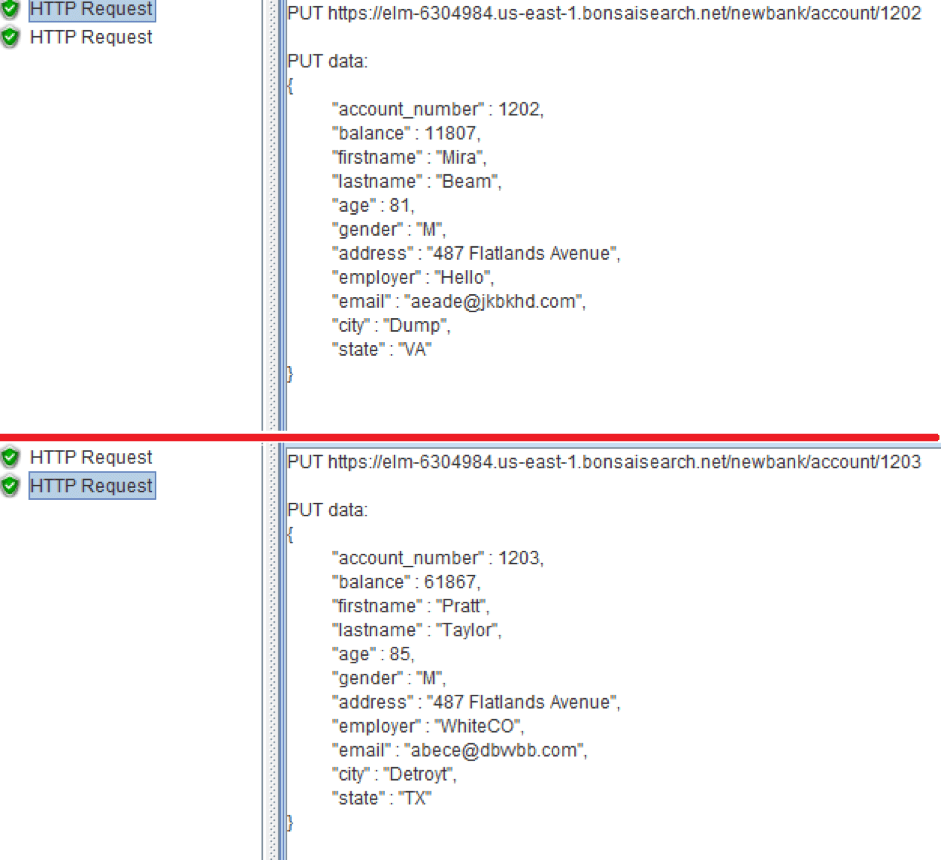
After that, each new document will contain various information about the user's bank account. You can see the result in the screenshot below.
If you tried to add a document but failed to get it and Elasticsearch handled the error, it will return the JSON with the error information, but the request code will indicate that the request is successful. Or the search suddenly began to produce incorrect search results.
This is not good because you might think the request was successful. Therefore, you need to check the response, and, for that, you can use Response Assertion.
Right click on HTTP Request Sampler -> Add-> Assertion-> Response Assertion
We set the 'Not' checkbox and 'Substring' Radiobutton. We also added an 'err' pattern. Now, even if the response code is successful, and the answer contains the 'err' substring, the request will be marked as unsuccessful.

If you want to check if the answer contains a certain, required document, then you do not need to set 'Not' checkbox and in the pattern, you need to specify, for example, the document id - "account_number : 703".
When completing your scripting, all you need to do is to increase the number of threads and, possibly, set the Throughput Timer to control the amount of generated requests.
This is all you need to know to create a load test for ES using JMeter. Now let's consider some of Elasticsearch's performance problems that can be identified with stress testing:
- Replicas and shards are designed to increase fault tolerance and the speed of operations when using parallel requests. But at the same time, a large number of them can significantly slow down the system.
- Split brain. When due to problems with the connectivity of the node over the network, or if the node does not respond for a long time, a second master node may appear in the cluster. In this case, it turns out that there are two versions of the index, and some documents are indexed in one part of the cluster, others - in the other. This inconsistency will manifest itself in the search: different results will be given for the same query. Therefore, you need to check not only errors but also search results.
- ElasticSearch is very sensitive to network problems. As soon as there is a network delay greater than zen.discovery.timeout, the node falls off. After some time it will join the cluster again and begin the recovery process. Updated shards will download from other nodes in a few threads and a large load on the cluster is created, which often leads to the situation when the whole cluster falls down like a card castle.
A few more main aspects of load testing for ES.
- The information is constantly read and recorded, therefore, ES likes good disks and RAM, so it is recommended that when carrying out load testing that you pay special attention to these parameters.
- Carry out the test sequentially: first, run the test with 1 replica and 1 shard (configured in the index), then increase them to the required number. This will help you determine their optimum number.
- Perform the test for a long time (several hours). This will help to see the productivity gains that occur as a result of costly operations.
That's it! You now know how to load test Elasticsearch with JMeter. To learn more about how to use JMeter in advanced scenarios, check out our JMeter academy.
Published at DZone with permission of , DZone MVB. See the original article here.
Opinions expressed by DZone contributors are their own.

Comments