Kubernetes Monitoring: Best Practices, Methods, and Existing Solutions
Kubernetes handles containers in several computers, removing the complexity of handling distributed processing. But what's the best way to perform Kubernetes monitoring?
Join the DZone community and get the full member experience.
Join For Free
Monitoring an application's current state is one of the most effective ways to anticipate problems and discover bottlenecks in a production environment. Yet it is also currently one of the biggest challenges faced by almost all software development organizations. Deadlines, inexperience, culture, and management are just some of the obstacles that can affect how successful teams are at overcoming this challenge.
The growing adoption of microservices makes logging and monitoring more complex since a large number of applications, distributed and diversified in nature, are communicating with each other. A single point of failure can stop the entire process, but identifying it is becoming increasingly difficult.
Monitoring, of course, is just one challenge Microservices pose. Handling availability, performance, and deployments are pushing teams to create, or use, orchestrators to handle all the services and servers. There are several cluster orchestration tools, but Kubernetes (K8S) is becoming increasingly popular when compared to its competitors. A container orchestration tool such as Kubernetes handles containers in several computers, and removes the complexity of handling distributed processing.
But how does one monitor such a tool? There are so many variables to keep track of that we need new tools, new techniques, and new methods to effectively capture the data that matters.
In this article, I will discuss the importance of monitoring K8S, what metrics can be used, and also compare several tools that can be used for this purpose.
Why Monitor Kubernetes and What Metrics Can Be Measured
As mentioned, Kubernetes is the most popular container orchestrator currently available. It is officially available in major clouds provided by Google, Azure, and, more recently AWS, and it can run in a local, bare metal data center. Even Docker has embraced Kubernetes and is now offering it as part of some of their packages.
Generally speaking, there are several Kubernetes metrics to monitor. These can be separated into two main components: (1) monitoring the cluster itself, and (2) monitoring pods.
Cluster Monitoring
For cluster monitoring, the objective is to monitor the health of the entire Kubernetes cluster. As an administrator, we are interested in discovering if all the nodes in the cluster are working properly and at what capacity, how many applications are running on each node, and the resource utilization of the entire cluster.
Allow me to highlight some of the measurable metrics:
- Node resource utilization - there are many metrics in this area, all related to resource utilization. Network bandwidth, disk utilization, CPU, and memory utilization are examples of this. Using these metrics, one can find out whether or not to increase or decrease the number and size of nodes in the cluster.
- Number of nodes - the number of nodes available is an important metric to follow. This allows you to figure out what you are paying for (if you are using cloud providers), and to discover what the cluster is being used for.
- Running pods - the number of pods running will show you if the number of nodes available is sufficient and if they will be able to handle the entire workload in case a node fails.
Pod Monitoring
The act of monitoring a pod can be separated into three categories: (1) Kubernetes metrics, (2) container metrics, and (3) application metrics.
Using Kubernetes metrics, we can monitor how a specific pod and its deployment are being handled by the orchestrator. The following information can be monitored: the number of instances a pod has at the moment and how many were expected (if the number is low, your cluster may be out of resources), how the on-progress deployment is going (how many instances were changed from an older version to a new one), health checks, and some network data available through network services.
Container metrics are available mostly through Cadvisor and exposed by Heapster which queries every node about the running containers. In this case, metrics like CPU, network, and memory usage compared with the maximum allowed are the highlights.
Finally, there are the application specific metrics. These metrics are developed by the application itself and are related to the business rules it addresses. For example, a database application will probably expose metrics related to an indices' state and statistics concerning tables and relationships. An e-commerce application would expose data concerning the number of users online and how much money the software made in the last hour, for example.
The metrics described in the latter type are commonly exposed directly by the application: if you want to keep closer track you should connect the application to a monitoring application.
Monitoring Kubernetes Methods
I'd like to mention two main approaches to collecting metrics from your cluster and exporting them to an external endpoint. As a guiding rule, metric collection should be handled consistently over the entire cluster. Even if the system has nodes deployed in several places all over the world or in a hybrid cloud, the system should handle the metrics collection in the same way, with the same reliability.
Method 1 - Using DaemonSets
One approach to monitoring all cluster nodes is to create a special kind of Kubernetes pod called DaemonSets. Kubernetes ensures that every node created has a copy of the pod, which virtually enables one deployment to watch each machine in the cluster. As nodes are destroyed, the pod is also terminated. Many monitoring solutions use the DaemonSet structure to deploy an agent on every cluster node. In this case, there is not a general solution; each tool will have its own software for cluster monitoring.
Method 2 - Using Heapster
Heapster, on the other hand, is a uniform platform adopted by Kubernetes to generally send monitoring metrics to a system. Heapster is a bridge between a cluster and a storage designed to collect metrics. The supported storages are listed .
Unlike DaemonSets, Heapster acts as a normal pod and discovers every cluster node via the Kubernetes API. Using Kubelet (a tool that enables master-node communications) and cAdvisor (a container monitoring tool that collects metrics for each running container), the bridge can store all relevant information about the cluster and its containers.
A cluster can consists of thousands of nodes, and an even greater amount of pods. It is virtually impossible to observe each one on a normal basis so it is important to create multiple labels for each deployment. For example, creating a label for database intensive pods will enable the operator to identify if there is a problem in the database service.
Comparing Monitoring Solutions
Let's take a look at five common monitoring solutions used by Kubernetes users. The first two tools (Heapster/InfluxDB/Grafana and Prometheus/Grafana) combine open source tools that are deployed inside Kubernetes. For the third option (Heapster/ELK) you can use your own ELK Stack or a hosted solution like Logz.io's. The last two options reviewed here (Datadog/Dynatrace) are APM proprietary solutions that provide Kubernetes monitoring.
The examples below are provided here. They use an Azure Container Service instance but should work in any Kubernetes deployment without too many changes. As part of the testing process, a pod is deployed with a function randomly logging messages.
Inside the repository folder, just type the command below to deploy it in your Kubernetes cluster:
> kubectl create -f random-logger.yamlHeapster, InfluxDB, and Grafana
The most straightforward solution to monitor your Kubernetes cluster is by using a combination of Heapster to collect metrics, InfluxDB to store it in a time series database, and Grafana to present and aggregate the collected information.
The Heapster GIT project has the files needed to deploy this design.
Basically, as part of this solution, you'll deploy InfluxDB and Grafana, and edit the Heapster deployment to send data to InfluxDB. Use the command
kubectl -f createin the influxdb folder.
The following command can be used to configure Heaspter to push metrics to InfluxDB:
> kubectl edit deployment/heapster --namespace=kube-system
command:
/heapster
--source=kubernetes.summary_api:””
--sink=influxdb:http://monitoring-influxdb.kube-system.svc:8086
After deploying all the pods, you should be able to proxy Kubernetes, and access Grafana ( kubectl proxy command).
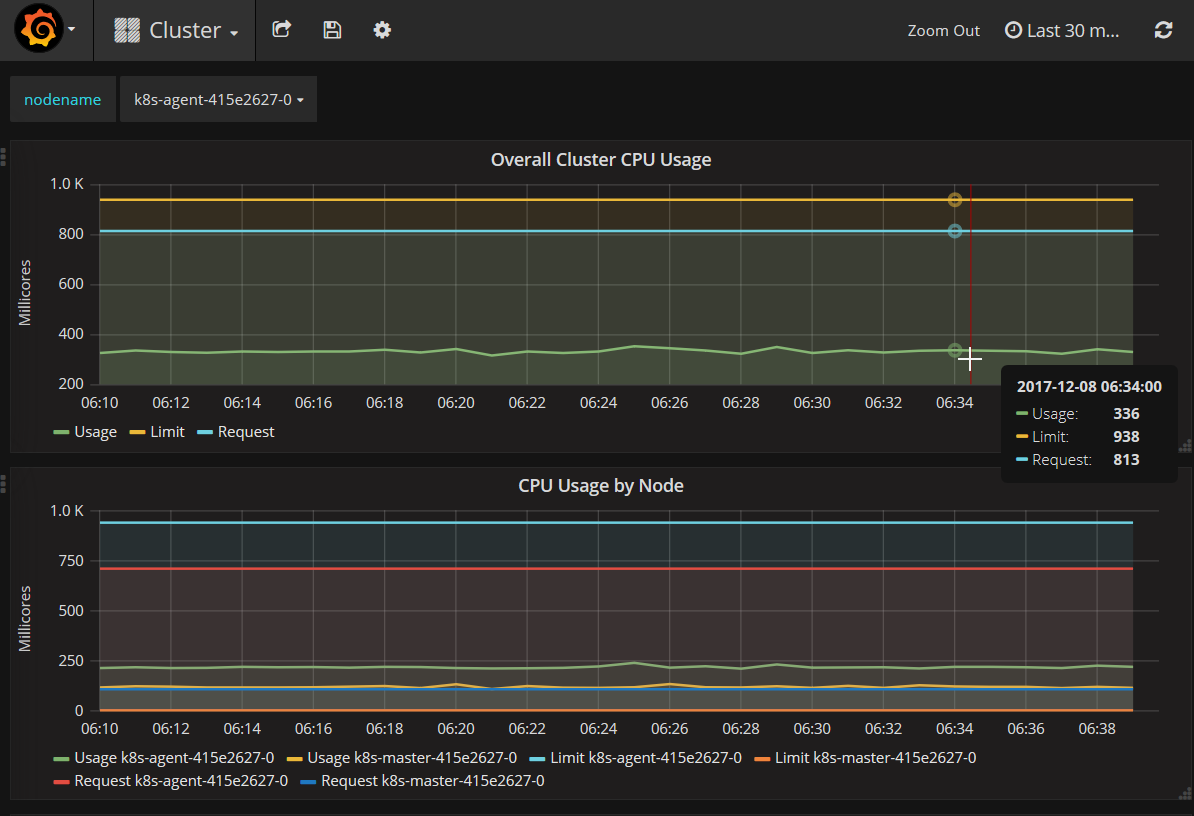
By default, Grafana will show you two dashboards, one for cluster monitoring:
The other for and other for pod monitoring:
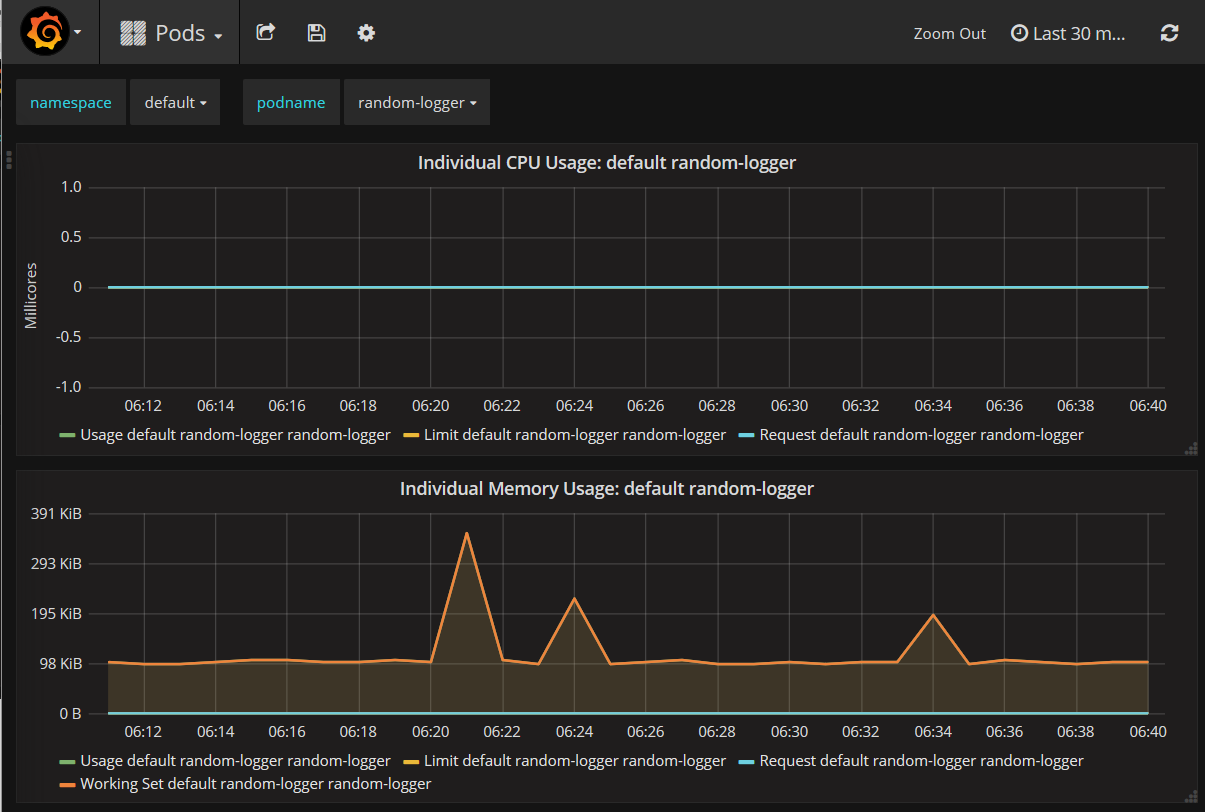
Grafana is an extremely flexible tool and you can combine several metrics into a useful dashboard for yourself. In the example above, we captured the metrics provided by Kubernetes and Docker (via ). They are generic metrics that every node and every pod will have, but you can also add specific metrics for applications.
Prometheus and Grafana
Prometheus is another popular solution for collecting Kubernetes metrics, with several tools, frameworks, and API's available for using it.
Since Prometheus does not have a Heapster sink, you can use InfluxDB and Prometheus together for the same Grafana instance, collecting different metrics, whenever each one is easier to collect.
In our repository, you just need to deploy Prometheus to start collecting data:
> kubectl create -f prometheus/prometheus.ymlThen, you can use the same Grafana instance by adding a new datasource to it.
Heapster + ELK Stack
The ELK Stack is a combination of three components: Elasticsearch, Logstash, and Kibana, each responsible for a different stage in the data pipeline. ELK is a widely used for centralized logging, but can also be used for collecting and monitoring metrics.
There are various methods of hooking in ELK with our Kubernetes. One method, for example, uses deploys fluentd as a DaemonSet. In the example below however, we will simply create an Elasticsearch sink for Heapster.
First, in the folder in our repository, run the files with:
Elasticsearch and Kibana will be automatically configured.
> kubect create -f . Elasticsearch and Kibana will be automatically configured.
Next, we need to add it as a Heapster sink. To do this, simply edit the heapster file as follows:
> kubectl edit deployment/heapster --namespace=kube-system

      - command:
        - /heapster
        - --source=kubernetes:https://kubernetes.default
        - --sink=influxdb:http://monitoring-influxdb.kube-system.svc:8086
        - --sink=elasticsearch:http://elasticsearch-logging:9200
Heapster will begin to send metrics to InfluxDB and Elasticsearch, and an Elasticsearch index with the heapster-YYYYMMDD format will be created.
To analyze the data in Kibana, first retrieve its external address:
> kubectl get service kibana-logging -n kube-systemUse the external IP with port 5601 to access the Kibana index configuration:
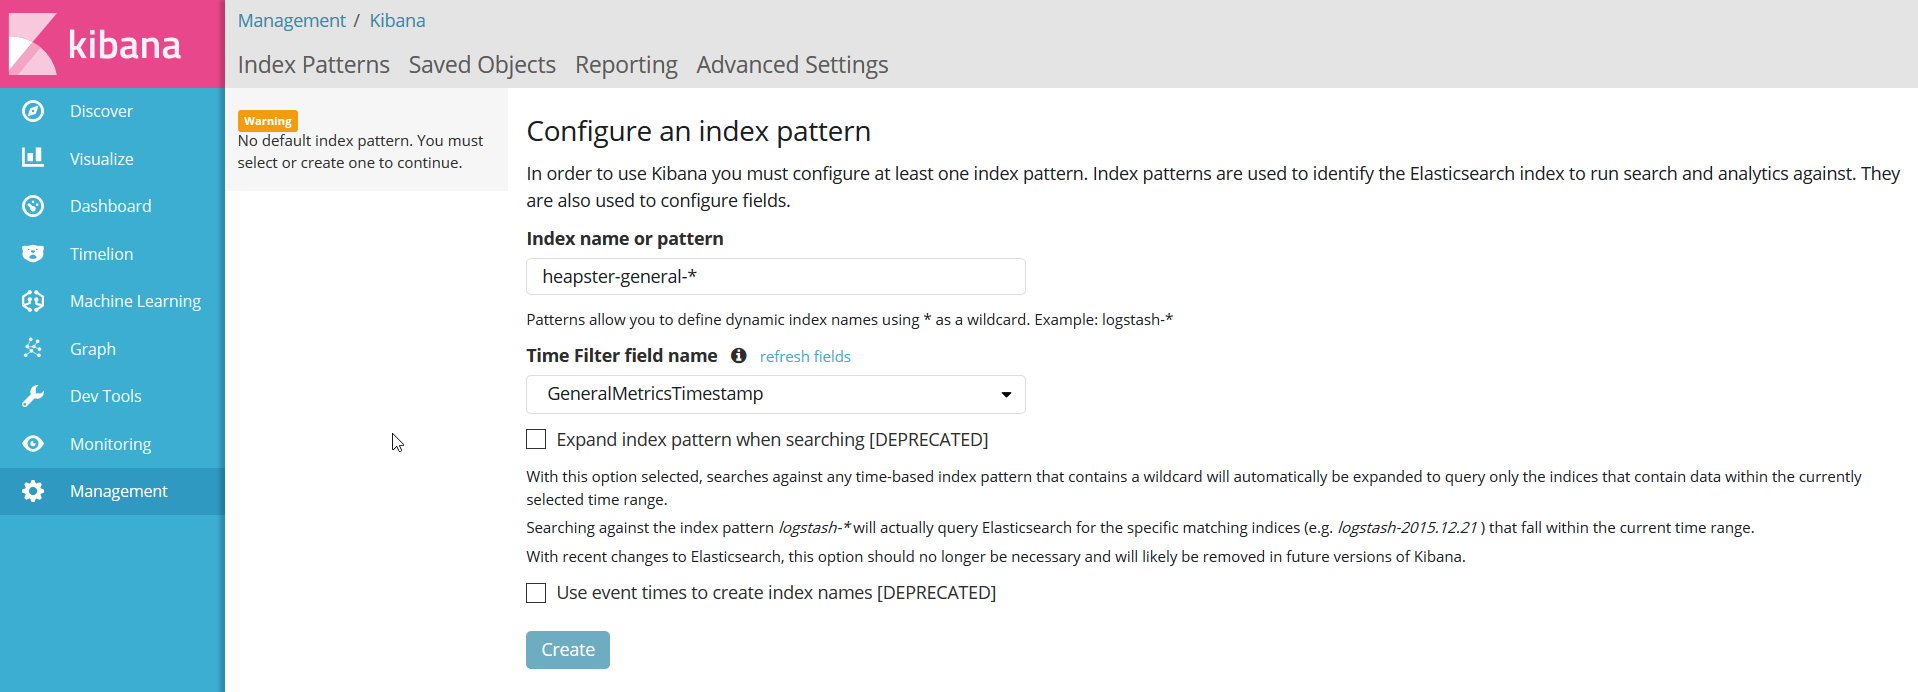
Define the index patterns in Kibana, and you should be able to see the metrics flowing.
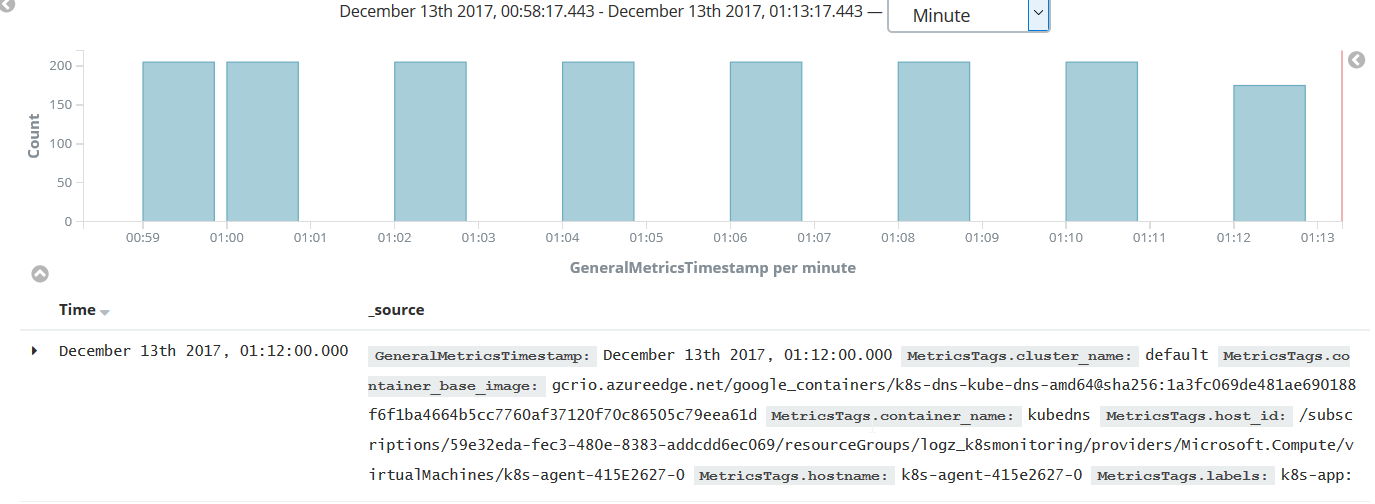
Needless to say, the example above is an overly simple Elasticsearch instance that is not designed for scalability and high availability. And if you are monitoring a cluster, you should also consider not storing the data inside the same cluster as this will affect computed metrics, and you will not be able to investigate issues in case the cluster is down. A cloud-based ELK solution such as Logz.io can be used as a secure and reliable ELK endpoint that will automatically scale as your data grows.
Metricbeat is another ELK monitoring solution that is worth mentioning and will be reviewed in a future post. This solution involves installing Metricbeat on each monitored server to send metrics to Elasticsearch. A Kubernetes module for Metricbeat is still in the beta phase, but you can already use this shipper to monitor your cluster, nodes, and pods.
Datadog
Proprietary APM solutions like Datadog aim to simplify monitoring by enabling organizations to monitor their applications and infrastructure more easily. By definition, these systems are designed so that setting up a data pipeline is as effortless as possible, a simplicity that will often come at a cost.
To start using Datadog for monitoring your Kubernetes cluster, simply create an account, and access the Integrations → Agents area. Search for Kubernetes, and select the displayed result.
You will be provided with a configuration file that you should save on your machine. Then, run this command:
> kubectl create -f dd-agent.yaml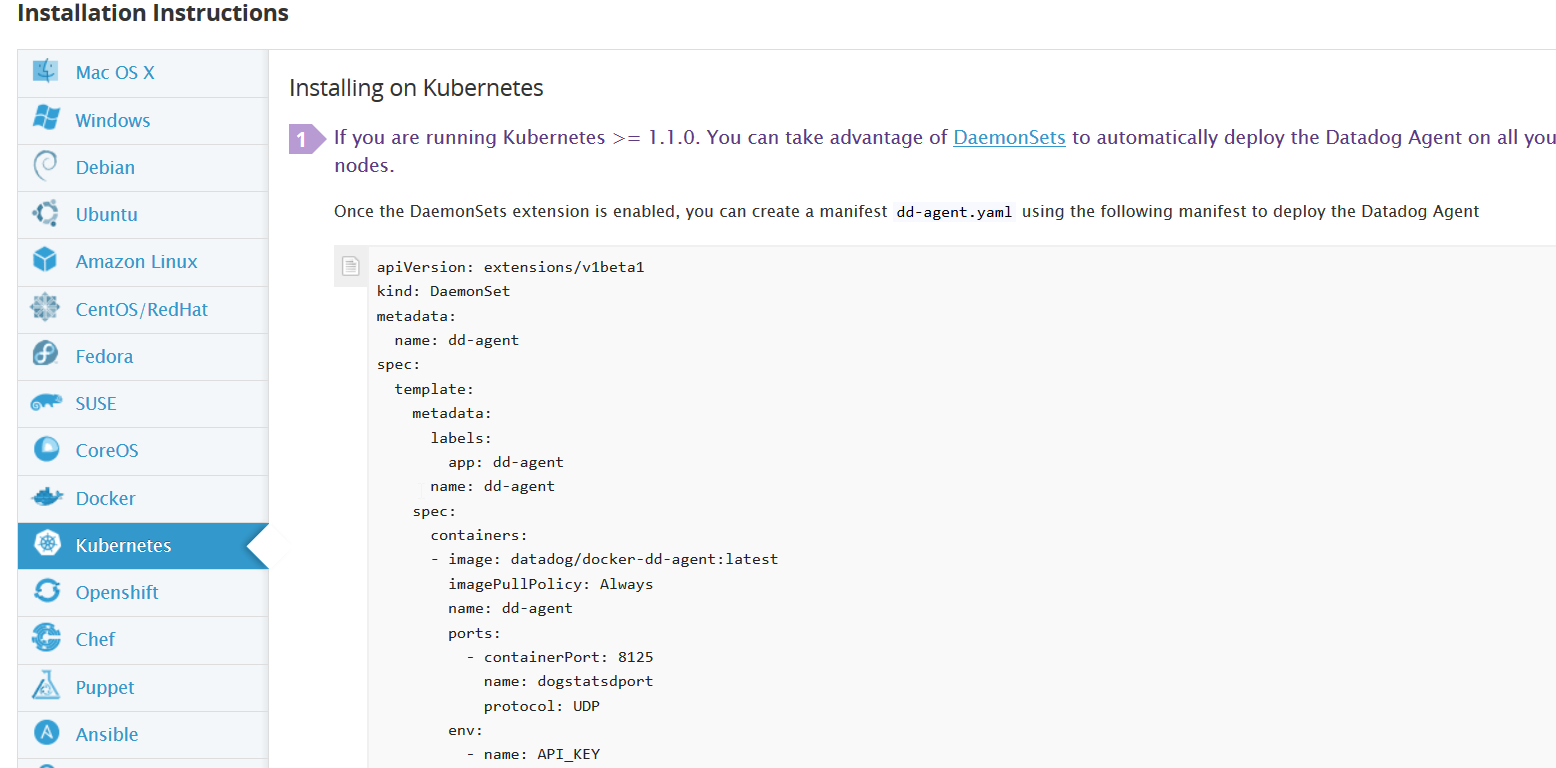
Datadog uses a DaemonSet agent that will be deployed in every cluster node. After a few minutes, you should have your cluster data flowing to the APM interface.
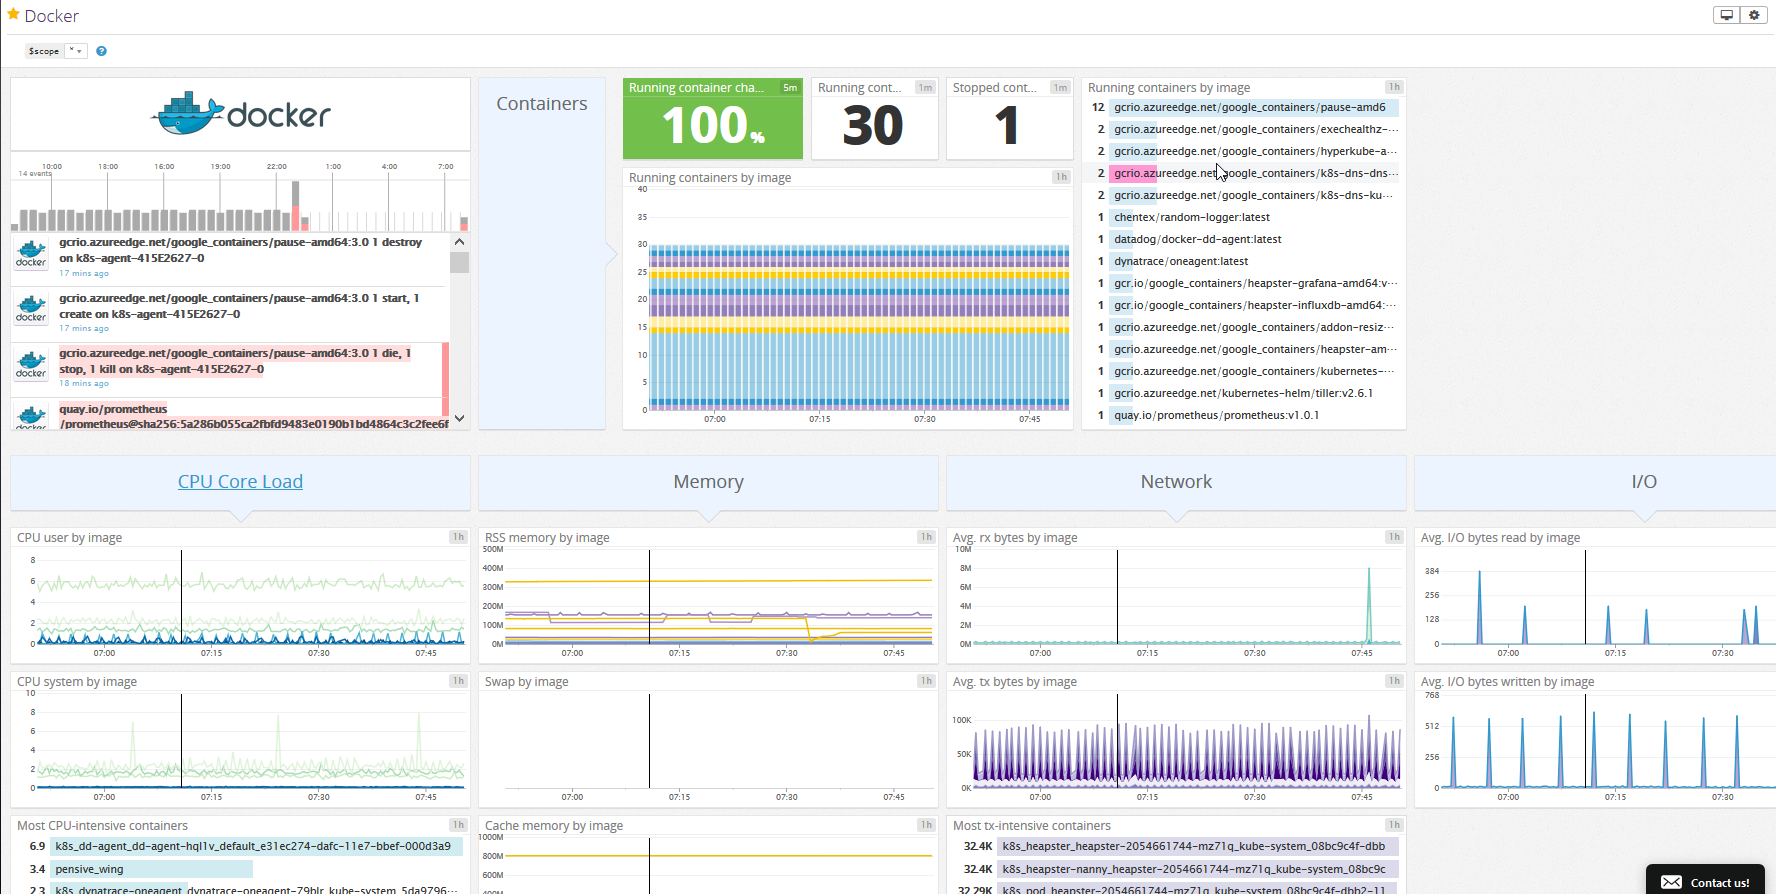
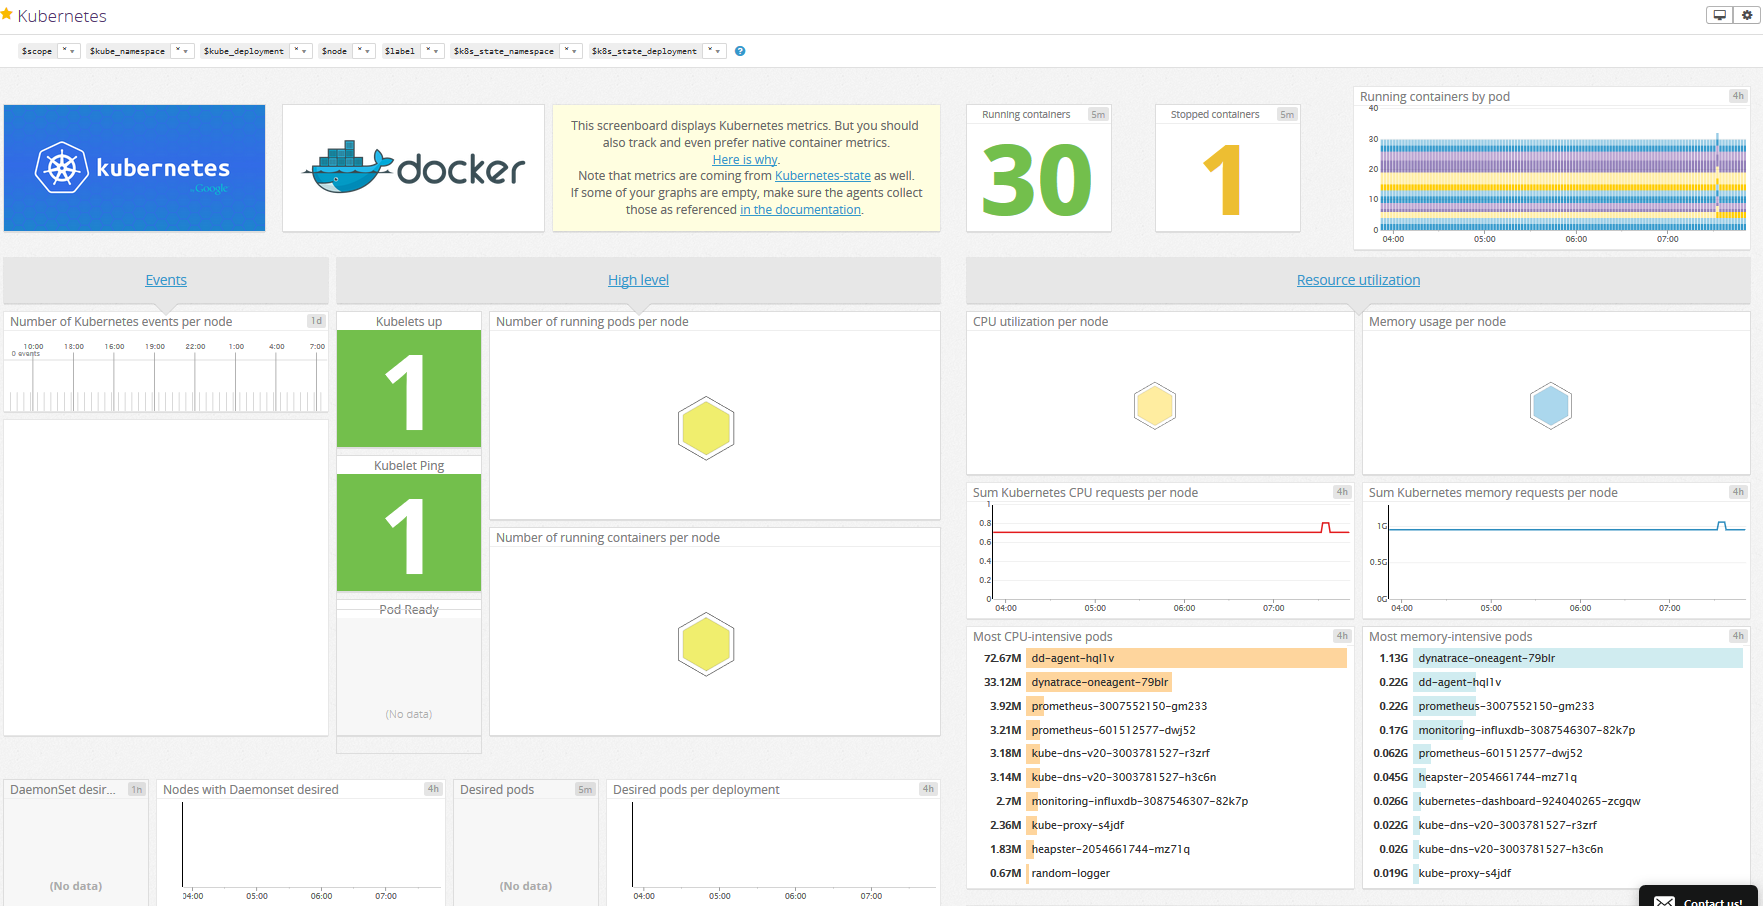
A good way to gauge Datadog's Kubernetes monitoring capabilities is to try the provided Kubernetes and Docker dashboards. These allow you to monitor the general health of your Kubernetes deployment:
Dynatrace
Dynatrace is another APM solution that provides an agent that will run as a DaemonSet in your cluster. The steps to have a Dynatrace agent deployed are less straightforward since you have to collect data from more than one page until you have a proper deployment file.
Once you have the file deployed using
Kubect create -f deployment-file.ymlyou'll have metrics flowing to Dynatrace in a few minutes.
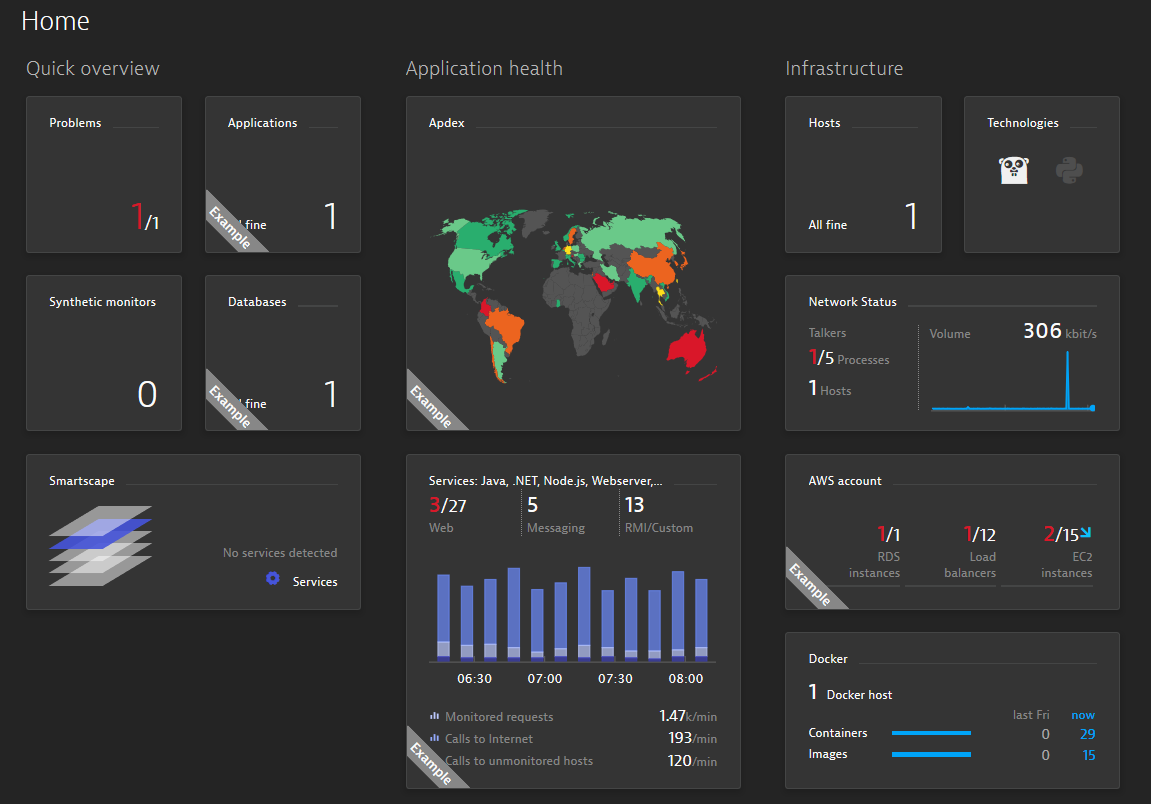
Dynatrace does not distinguish between a simple Linux host and Kubernetes nodes, so you can't expect some useful Kubernetes metrics exposed by default like with Datadog.
Here is an example of the Dynatrace dashboard:
Endnotes
As mentioned above, monitoring Kubernetes is one step, but to have a comprehensive view you will need to monitor the applications themselves as well. No one said it was going to be easy!
In this article, we've explained the importance of monitoring for a distributed system and reviewed the different types of metrics available and how to use them with different technologies.
What technology you end up using, whether open source solutions or a proprietary SaaS solution, will depend of course on your needs, the level of expertise of your engineers, and of course, your budget.
Published at DZone with permission of Daniel Berman, DZone MVB. See the original article here.
Opinions expressed by DZone contributors are their own.

Comments