KubeCon: Summary of the Open Observability Day North America
This post provides an overview of the one-day inaugural event known as Open Observability Day event in Detroit.
Join the DZone community and get the full member experience.
Join For FreeToday was the one-day inaugural event known as Open Observability Day, held as one of the off-site options before the full KubeCon and CloudNativeCon event this week in Detroit.
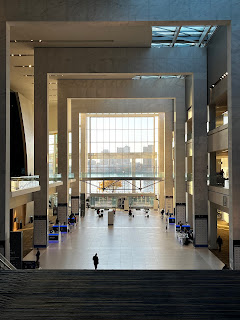
It was on-site at the Huntington Place Convention Center, which is on the river with views across the water into Canada (just a bit of geography as many attendees I spoke with were not aware that Detroit was so close to the northern US border).

The full schedule for Open Observability Day is available online but wanted to share an overview impression of what it was like to be there.
The day is centered around all of the CNCF projects related to open observability and is full of both vendors and project-focused talks. Let's look closer at my impressions of the sessions I found interesting.
The day started with CNCF project founder Bartek Płotka and his overview of the day, the project updates across Thanos, Fluntd, OpenTelemetry, Jeager, and more. He then transitioned to the two short keynotes.
Distributed Tracing: The Struggle Is Real
Ian Smith, Field CTO from Chronosphere, shared his thoughts after nine years in the field working with distributed tracing solutions. He takes us on a whirlwind tour of where it came from and where it might be going along with what technical problems around tooling supporting distributed tracing. Here is a great quote as a takeaway:
Tracing has become the high-promise, high-effort, low-value story.
Observability Simplified
Eduardo Silva, CEO of Calyptia, shared the storyline from creating the Fluentd project to the new Fluent-bit project focused on cloud-native environments. He then walked through their experiences in the logging space building the Fluent Bit project and how extending the ecosystem to support metrics and traces has helped shape a simplified user observability experience. He announced the release of Calyptia Core, using open-source tooling to collect data through data pipelines without using agents. It's free to use right now and can be installed into existing Kubernetes clusters. They also have a Docker desktop extension.
Both keynotes were very short, just 10 minutes, after which the main talks started.
Building Observability Pipeline With Fluent Bit
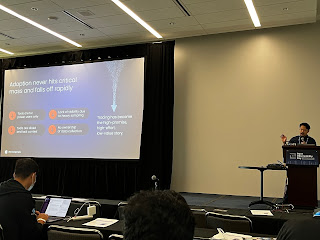
Chao Xu from LinkedIn talked about how they transitioned off of existing closed tooling for their observability pipeline to open source and open standards. They mainly use Fluent Bit and Open Telemetry. They also expanded their instrumentation of languages from just Java applications to Go, C++, and Python. They consolidated their tracing and logs into a single pipeline instead of separate data pipelines, creating simpler maintenance standards and fewer resource loads. They are big believers in the OTEL Collector, but they expanded it as their new expanded Observability Agent to support data conversion and filtering along with the ingestion of OTEL data streams. LinkedIn also really likes the enhanced tag management that Fluent Bit offers to handle the various data streams.
Why Large-Scale Observability Needs Graph
Richard Benwell from SquaredUp takes a deep dive into the observability Wikipedia page, which is a rather interesting way to try to build the foundation of what we mean by o11y. He uses this to show that we have signals with metrics, logs, and tracing, but we are missing the model of our system in current observability platforms. This talk postulates that signals are useless without models. He goes on to use architectures as models for the metrics, logs, and tracing we are gathering. This begs the question: do you need architects to design your models, or do you just generate models such as tracing tools often do? Also, the model is nice (it helps with understanding), but you need to be able to gain insights into the meanings of the data you are gathering and modeling. The talk then dived into a graph 101 course that we all took at university, with vertex to edge to vertex type of stories. It brought back fond memories of both math courses and AI domain modeling to solve problem domains such as healthcare diagnostics.
Confidence with Chaos for Your Kubernetes Observability
Michael Friedrich from GitLab shares how we've gone from running cloud native environments to monitoring them with CNCF projects like Prometheus, Perces, Graphans, etc. Now we are buried under all the incoming data, which is not a new concept. So now that we have this, he shares a few ideas about breaking things on purpose to see how it behaves, monitors, and recovers. He highlights the project Chaos Mesh, and it's an interesting idea of how to see how entire environments will respond to problems. The talk ends with a live demo of the use of Chaos Mesh.
Before and after lunch there were several lighting talks, just short 10-minute sessions.
- Achieving Unified Observability for Cloud and Edge with FluentBit
- Making Sense of Observability with Auto-Discovered Security Policies
- Managing OpenTelemetry Through the OpAMP Protocol
- OTel Me How to Build a Data Pipeline for Observability
- What Can eBPF Actually do for Modern-day Observability?
The afternoon finished up with full breakout sessions:
![Breakout session]() Adopting Open Telemetry Collector at eBay: Swapping Engines Mid Flight
Adopting Open Telemetry Collector at eBay: Swapping Engines Mid Flight
Vijay Samuel from eBay shared experiences of moving from Elastic Beats for traces to Open Telemetry. He talked about their cloud-native scale, the problems they've had, the journey from Metric Beats to OTEL collector, bridging the gaps around dynamic config reloading, and ensuring data parity after the migration. It was very interesting, and they are looking for engineers.
Leveraging OpenTelemetry for Your Prometheus Pipeline
Goutham Veeramachaneni from Grafana Labs and Prometheus maintainer for over five years shares how to leverage OTEL in your Prometheus data pipelines to add traces to your metrics infrastructure.
This overview does not include all of the talks held today but gives a nice impression. I must admit, I was unable to capture all of the sessions due to networking that happens during the breaks. Several times, I got into in-depth discussions that kept me out in the halls or at a booth longer than the breaks were planned for, but that's what these events are for!
Published at DZone with permission of Eric D. Schabell, DZone MVB. See the original article here.
Opinions expressed by DZone contributors are their own.


Comments