KubeCon EU: Summary of Observability Day Europe
The KubeCon + CloudNativeCon event kicked off with a slew of off-site events. In this post, learn what was shared on Observability Day Europe.
Join the DZone community and get the full member experience.
Join For FreeThe KubeCon + CloudNativeCon event kicked off with a slew of off-site events. I dropped in on Observability Day Europe and wanted to share a few things I found interesting.
 This event was set up to foster collaboration, discussion, and knowledge sharing of cloud-native observability projects (including but not necessarily limited to Prometheus, Fluentd, Fluent Bit, OpenTelemetry, and OpenMetrics), as well as vendor-neutral best practices for addressing observability challenges. It was intended both for audiences that are new to observability as well as for seasoned practitioners. Observability Day enabled you to spend a day peeking under the hood of major Cloud Native Computing Foundation observability-related projects and broadening your knowledge of observability.
We were on-site in Amsterdam at the RAI conference center. The full schedule for Observability Day is available online but I wanted to share an overview impression of what it was like to be there.
The day is centered around all the CNCF projects related to open observability and is full of both vendors and project-focused talks.
The day started with a welcome and overview which transitioned into a series of CNCF project updates in the observability domain starting with Prometheus, and on to OpenTelemetry and Fluentbit. Here are some notes I took about what they announced:
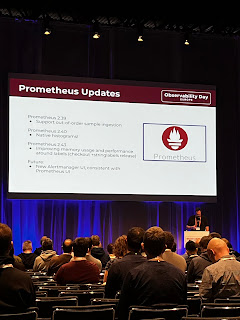
Prometheus Updates![Prometheus updates]()
Richard Hartmann, updated us on some of the newly released features you can explore and should update to with Prometheus version 2.43:
- Support out-of-order sample ingestion
- Native histograms (new)
- Massive memory usage improvements (less!)
There would be serval more in-depth sessions in the main event this week.
OpenTelemetry
Austin Parker shared updates on the work they've been releasing with the OpenTelemetry project:
- Metrics API/SDK improvement + histogram support
- Logs -> Log Bridge
- Finalized the communication protocol OTLP declaring it stable
- Announcing merging with Elastic converging on ECS standards
This project also had several sessions in the main event this week.
Fluent Bit
Eduardo Silva updated us on the newest release version 2.1 with all of the following goodness: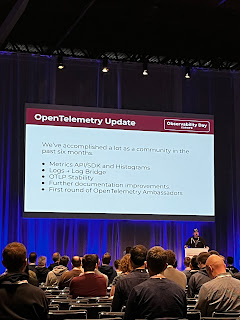
- Hot reload support
- Convert from logs to metrics
- Linux, Windows (arm64) host metrics
- Podman container metrics
- Metadata support for logs
- Processors (sort of pipeline)
He closed out mentioning they have over 6.3 billion downloads!
Prometheus Native Histograms in Production
I chatted with Björn Rabenstein before his session on the research results that are the native histograms in Prometheus. Beorn presented some of the first results from native histogram usage "in the wild." He explored what works well and what needs more work. Most importantly, he explored performance characteristics when turning up the resolution or when generously partitioning a histogram along multiple dimensions. Another theme is the data collection side, including topics like native histogram adoption in instrumentation libraries and OpenTelemetry interoperability.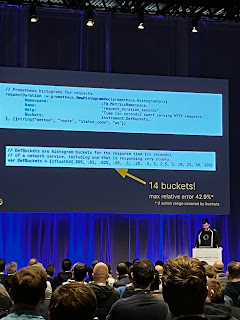
He walked us through the limitations currently of a max of 14 buckets in your histograms, and that when you are using a lot of metric labels, you will notice massive memory usage. He moved on to how they are fixing this to allow, for example, 100 buckets for your histograms. All of this was shared with example loads on deploying this to test it on a real system. Good progress is being made and we'll see this soon in Prometheus.
Using OpenTelemetry's Exponential Histograms in Prometheus
This talk by Ruslan Kovalov and Ganesh Vernekar explores how OpenTelemetry is exporting telemetry data as metrics (now GA) and promising to be fully compatible with Prometheus. In this session, they discussed how both OpenTelemetry and Prometheus started work on high-resolution histograms independently of each other while they actively collaborated to keep both histograms compatible with each other.
These new histograms bring a whole new set of capabilities over the conventional histogram present in Prometheus, including but not limited to, better storage efficiency, higher accuracy of quantile estimations, flexible histogram buckets, simple configuration, etc. This session dived pretty deep into the current capabilities and design of high-resolution histograms and how to use OpenTelemetry's high-resolution histograms in Prometheus with its native support for translation.
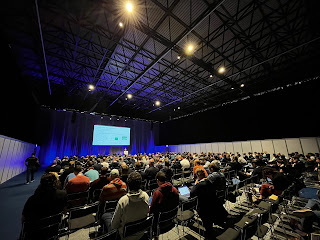
This was followed by a series of sessions where solutions were shared and vendor implementations were touted using various elements of the CNCF observability ecosystem.
Following a lunch break, the afternoon kicked off with a panel session on the future of observability. Don't worry, the final outcome is that the future is bright!
Note: This was all live-streamed so I would suggest searching for the playlist for this day that will be posted in the near future.
Published at DZone with permission of Eric D. Schabell. See the original article here.
Opinions expressed by DZone contributors are their own.

Comments