JMeter vs. Locust: What to Use When
This article compares and contrasts Apache JMeter and Locust, two of the most well-known and popular performance testing tools.
Join the DZone community and get the full member experience.
Join For FreeApache JMeter and Locust are two of the most well-known and popular performance testing tools used by developers in the IT community and by different companies. In this article, we will provide a side by side comparison of JMeter and Locust, by covering the most important aspects of these frameworks. This will help you determine which tool is better for your unique performance test case and for different specific load testing cases.
If you need to compare JMeter with additional tools: The Grinder, Gatling, and Tsung, read this blog post. Now let’s get started.
1. JMeter and Locust - An Introduction
JMeter is one of the most solidly proven performance frameworks, with its first version released almost 20 years ago. It is written in pure Java language and has an elaborate versions history. Initially, JMeter was developed to perform load testing of Web and FTP applications. However, nowadays it allows testing almost any application and protocol, enabling users to create tests by using a desktop application that is compatible with any OS platform. Learn JMeter for free from the JMeter academy.
Locust, on the other hand, is a relatively fresh performance framework written in Python, widely known for the past five years. The main feature of this framework is that it allows you to write performance scripts in pure Python. In addition to its “test as code” feature, Locust is highly scalable due to its fully event-based implementation. Because of these facts, Locust has a wide and fast-growing community, who prefer this framework over JMeter.
2. Open Source License
The question of a tool’s license scope is one of the most important ones, because you would want to know if you would need to pay for additional 3rd party tools to complete your load test. If a tool is open source, you can achieve almost any goal you set for your performance tests without any additional payments. Open source JMeter and Locust are no exception.
Both JMeter and Locust provide a permissive software license which enables free software with minimal requirements about how this software can be distributed. JMeter was developed by Apache and it is based on the Apache License 2.0, while Locust was developed by a small team of community-driven developers and is based on MID license. In both cases, these tools are open source and allow you to use them freely without any limitations regarding usage.
3. Load Test Creation and Maintenance
There are three main steps in a performance test workflow: create, run and analyze. It's not a secret that usually, the first step is the most time-consuming. There might be different exceptions to this rule but if your application is written well, you should not spend more time on running the tests and analyzing the results than on tests creation. That’s why this step is very important for our comparison. Because being comfortable with a performance tool, means, first of all, that you should be comfortable with the tests creation step.
The most common way to write a JMeter performance test is by using its GUI mode. The JMeter GUI mode provides a desktop client that allows you to easily create tests without having to write a single line of a code (until you need to create a tricky test). So the simplest scenario might look like this:
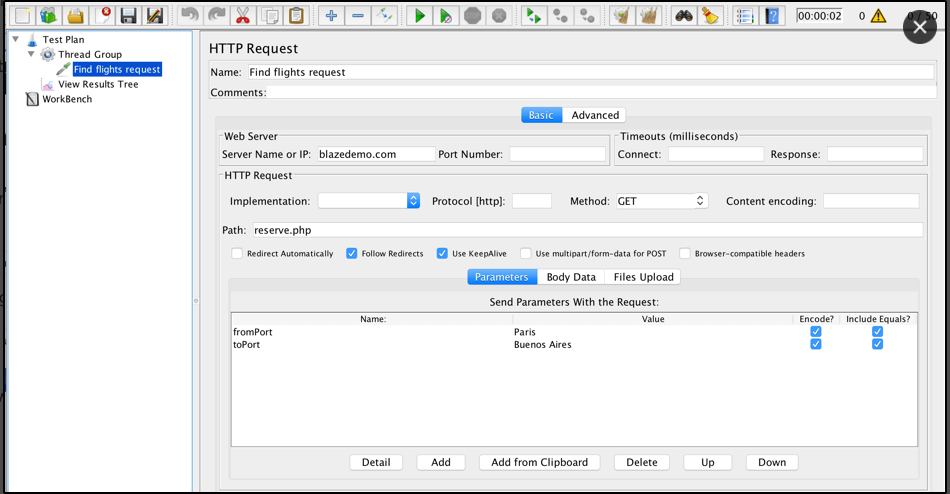
JMeter is very straightforward and usually, even a non-experienced engineer can read and write basic scenarios without any trouble. But if you need to, you can use a code, both in its GUI and in non-GUI mode, with Java. However, this way is not popular across the JMeter community due to the complexity of scripts implementation (as JMeter was designed to be used with GUI mode) and lack of documentation on how to make such scripts. But if you are interested in an example, you can get this StackOverflow answer as a good example of how you can create the test with a code on JMeter and Java.
On the other hand, Locust is all about coding. You need to have at least some basic Python coding experience to feel comfortable with performance tests creation. This is the same test scenario as we had before, but implemented using Locust:
from locust import HttpLocust, TaskSet, task

class FlightSearchTest(TaskSet):

    @task
    def get_something(self):
        self.client.post("/sreserve.php", {
            'fromPort': 'Paris', 'toPort': 'Buenos+Aires'
        })

class BlazeDemoSiteTests(HttpLocust):
    task_set = FlightSearchTest
Scripts written in Locust look more or less clear but as soon as you are creating a huge complicated test, it might be a bit complicated to review it.
On the other hand, having all your tests in code is a big advantage, which allows you to easily fix tests without UI. This might be very handy if you run your script in the server without desktop client access. Coding also enables verifying all tests changes that have been done by your teammates, by using a version control system like Git. It also makes it much faster to make script changes during maintenance work, since code change is faster and simpler rather than opening a UI application and committing the required changes via the console.
4. Supported Protocols
It is always easier if you can use the same tool to run performance tests for different parts of your system. Ideally, you should be able to test everything using the smallest number of tools possible, as long as it doesn’t impact the quality of your testing. That’s why this comparison step is important - because if you need to use different tools to test different protocols, you need to spend more time in support, find engineers with wider experience and come up with different hooks to run these tools together in case of integration tests.
With JMeter, you can use a full arsenal of built-in functions and third-party plugins to create performance tests for everything in one place. You can test different protocols or even databases without any coding. These include JDBC, FTP, LDAP, SMTP and many others.
Based on the documentation, Locust was built mainly for HTTP web based testing. However, you can extend its default functionality and create a custom Python function to test anything that can be tested by using the Python programming language. To sum up, you can test everything you want but each custom script requires additional efforts and Python programming experience.
5. Number of Concurrent Users
This section of comparison is one of the most critical ones, because a performance tool should allow you to run as many users as you need to achieve your testing goals. In some situations and some tests, it is required to simulate thousands or millions of users, when for other tests and situations it is enough to run just a hundred users. How many users do you need? Read this blog post to learn how to decide.
The number of concurrent users each tool can run, is mostly based on the resources they require for running each user in the load test. JMeter and Locust have absolutely different ways of dealing with machine resources. JMeter has a thread-based model, which allocates a separate thread for each user. Threads allocation and benchmarking each of these steps takes a noticeable amount of resources, and that’s why JMeter is very limited regarding an amount of users you can simulate on one machine. The number of users that you can run on one machine depends on many factors like script complexity, hardware, response size and so on. If your script is simple, JMeter allows you to run up to thousands on one machine before script execution gradually becomes unreliable.
On the contrary, Locust has a completely different user simulation model, which is based on events and async approach, with gevent coroutine as the cornerstone of the whole process. This implementation allows the Locust framework to easily simulate thousands of concurrent users on a single machine, even on a very regular laptop, while running complex tests with many steps inside.
To give you a better idea, we can run the same test for 50 users by using both tools frameworks, to show you how many resources were occupied in both cases:
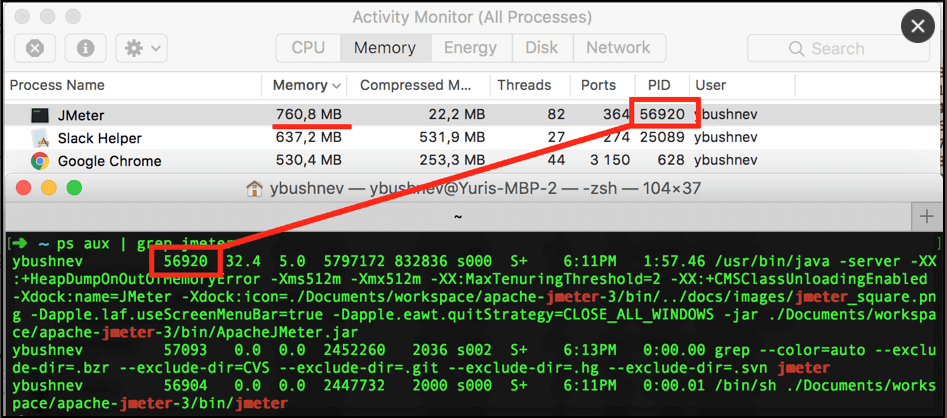
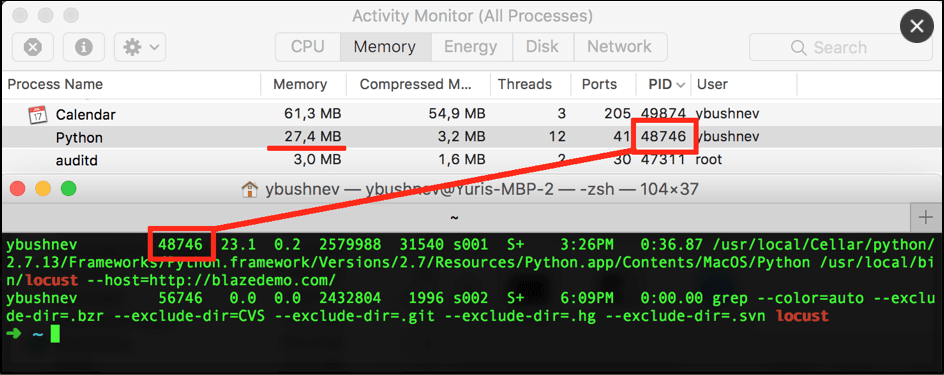
You can see that JMeter running in GUI mode for the same scenario takes almost in 30x more memory than a Locust script. Running using Non-GUI mode will save your resources but in the provided example, I couldn't run the script allocating less than 420MB for test execution in JMeter, which is still in 14x times heavier than the same run in the Locust.
Please note that both tools can be easily used in a distributed mode when you have a master that performs results aggregation and a number of slave nodes that perform target requests.
6. Ramp-up Flexibility
Flexible ramp-up abilities are extremely important, for simulating all possible use cases of your application. For example, during load testing, you might want to create a spike load, so you could verify how the system handles unexpected spikes, in addition to its gradual load.
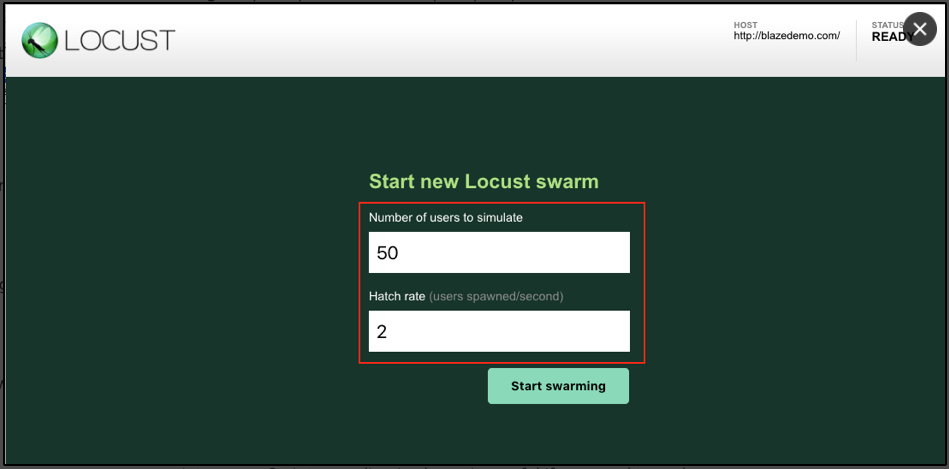
By default, both tools provide relatively the same way to generate loads - you can specify how many users you want to use during the performance test and how fast they should come on board.
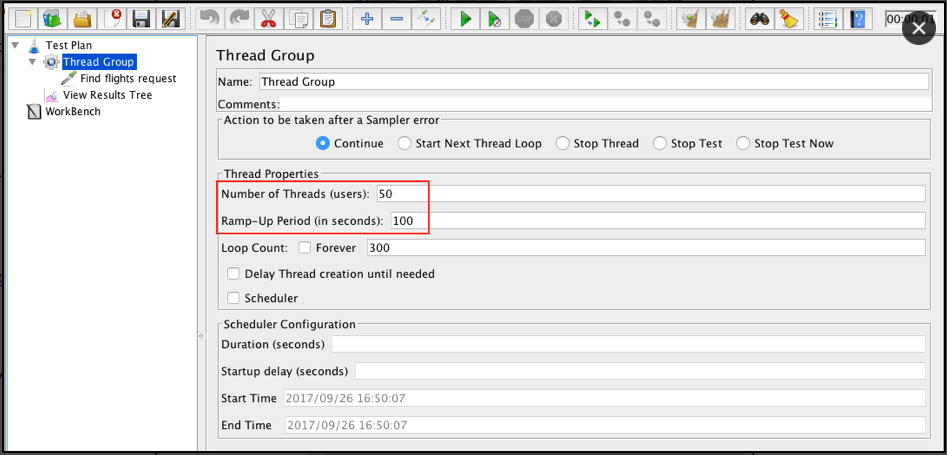
In JMeter you can configure a load in the “Thread Group” controller in specified fields:
But JMeter also has additional plugins that enable you to configure a very flexible load. One of the best ways to do that is to use the Ultimate Thread Group, which allows users to make very specific load patterns:
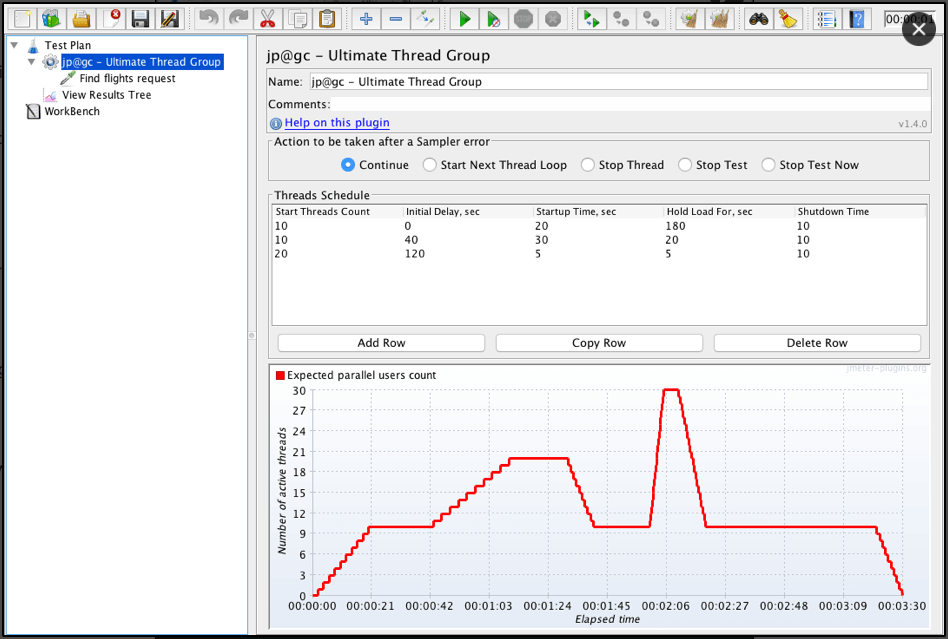
But there are many more ways, which you can read about in this blog post. That’s why in this aspect JMeter has a huge advantage.
Locust has a different approach. When you run a performance script, Locust automatically starts a server on http://localhost:8089 with a web interface which gives you input elements to specify only a linear load:
7. Script Recording
Script recording is an efficient way to create a basic test template, which you can then clean up from redundant logs and refactor for further maintenance. Script recording is also quite useful if you need to make a quick workaround and run a specific load based on repeated actions. In such situations, you don’t want to lose time on script creation, especially if you won’t need that script later on. Script recording is not recommended if you are going to run stable performance tests again and again, since they are not very stable.
This is where JMeter has a strong advantage, as it has built-in functionality for script recording, while Locust doesn't have this feature at all. In addition to that, there are many third-party plugins which can make a script recording for JMeter. One of the most convenient ways to record such scripts is to use BlazeMeter chrome extension.
8. Load Tests Monitoring
Both JMeter and Locust provide great built-in functionalities to monitor performance scripts and analyze your tests results. JMeter has many different elements called listeners. Each listener provides a specific type of monitoring:
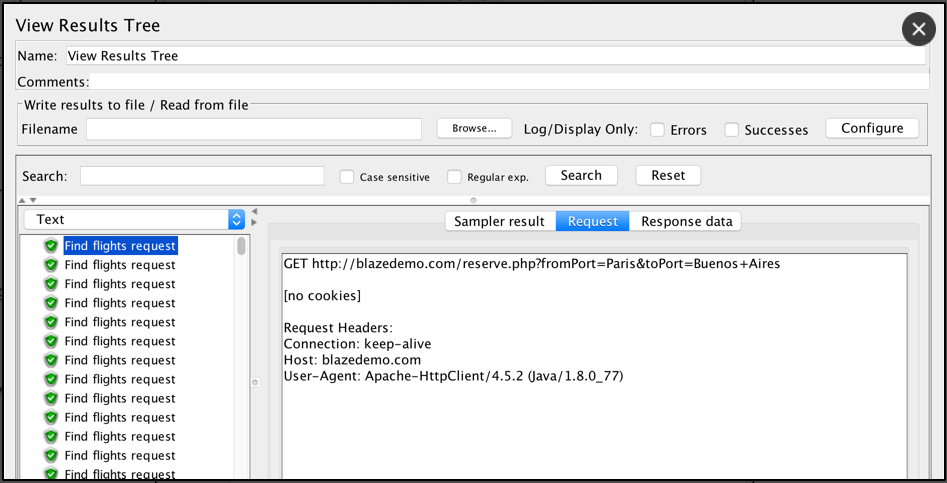
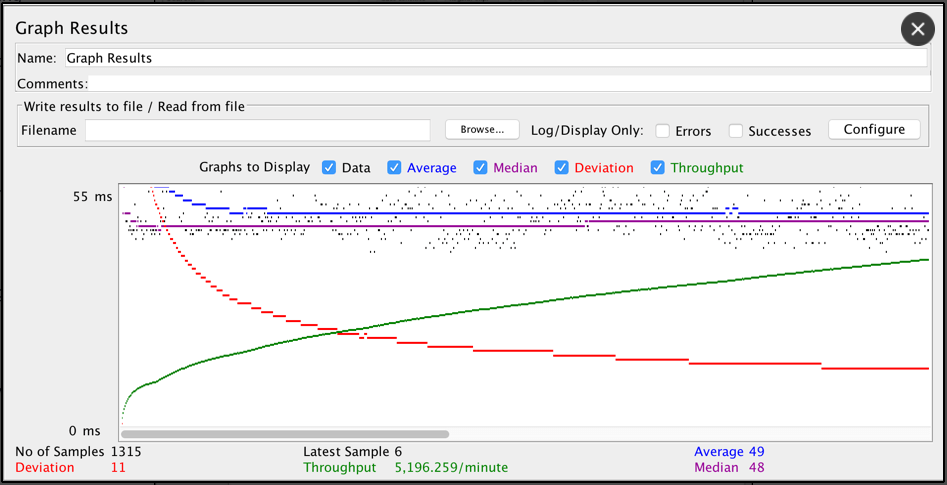
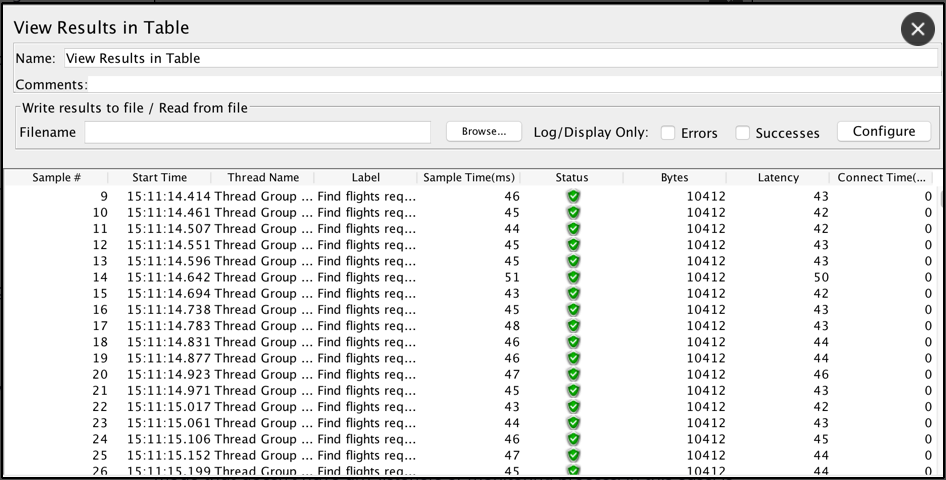
JMeter has a lot of inbuilt listeners, and you can also extend the default library with many existing custom listeners as well. Learn about JMeter Listeners from this blog series, starting here.
On the other hand, JMeter listeners consume a lot of resources on the machine they run on. That’s why, usually, JMeter is executed with a non-GUI mode that doesn’t have any listeners or monitoring process, in this case, is done using different 3d party tools, like BlazeMeter. You can find this article interesting to read if you want to monitor your JMeter scripts in non-GUI mode.
As for Locust, it has a not so wide arsenal of monitoring capabilities. But at the same time, Locust provides almost all the information that can be useful for monitoring a basic load. During a script run, Locust runs a simple web server where you can find all the available monitoring results:
In comparison with JMeter, Locust monitoring doesn’t take up so many of your machines’ resources. That’s why Locust has a great benefit over JMeter, as you can use built-in monitoring even if you need to simulate a lot of users. On the other hand, default monitoring doesn’t provide very detailed information that you can get from 3rd party tools. That’s why you probably want to check other options for script monitoring.
One of the easiest ways to monitor and analyze your test results is to use the Taurus framework with BlazeMeter reporting, which gives you outstanding real-time reports with the ability to save them for further comparison. You can check out this article to get a basic idea.
JMeter and Locust Comparison Table
Take a look at this comparison table of JMeter and Locust features and abilities:
JMeter |
Locust |
|
| Operating System | Any | Any |
| Open Source | Yes | Yes |
| GUI | Yes, with non-GUI mode available | No |
| Execution Monitoring | Console File Graphs Desktop client Custom plugins |
Console Web |
| Support of “Test as Code” | Weak (Java) | Strong (Python) |
| In-built Protocols Support | HTTP FTP JDBC SOAP LDAP TCP JMS SMTP POP3 IMAP |
HTTP |
| Integrated Host Monitoring | PerfMon | No |
| Recording Functionality | Yes | No |
| Distributed Execution | Yes | Yes |
| Easy to use with VCS | No | Yes |
| Resources Consumption | More resources required | Less resources required |
| Number of Concurrent Users | Thousands, under restrictions | Thousands |
| Ramp-up Flexibility | Yes | No |
| Test Results Analyzing | Yes | Yes |
Summary
As we mentioned at the beginning, we are not going to say which tool is better because there is no better tool. If you like Python, if you are strong with Python or if you just prefer coding over UI tests creation, then you should go ahead with Locust. Otherwise, JMeter might be a better choice.
Also, it might be better to start with JMeter if you are not experienced in performance tests creation, as the JMeter UI itself shows you right away which options you have to achieve your testing goals. Just a simple navigation through the menu gives you an idea which samplers you can use to create a load, which timeouts you can use to make script pauses and which configuration you can add using inbuilt configuration elements. On the other hand, Locust gives you only documentation and some code examples on top of which you can know if you are able to implement required load script based on your Python expertise.
Test coding with Locust brings its own benefits. For example, it is much easier to maintain and configure performance tests for different environments under a version control system like Git. For such needs, dealing with code is more preferable. In Locust’s case, it is definitely more preferable if you know Python. At the same time, if you prefer coding rather than UI tests creation but you are not comfortable with the Python scripting language, have a look at the Taurus performance testing framework, which allows you to write tests using human-readable data serialization YAML language.
However, in other situations: if you need to perform a complex load including different protocols, if you cannot spend time writing your own samplers using Python, if you need the script recording functionality, if you need to simulate specific load with some custom ramp-up patterns, if you just prefer UI desktop app for scripts creation, or you just do not know Python well enough, then JMeter looks like the better option for you.
Locust was created to solve some specific issues of current existing performance tools and it did it great. Using this framework and some Python experience you can write performance scripts pretty fast, store them within your Python project, spend minimum time on maintenance without additional GUI applications and simulate thousands of test users even on very slow machines.
Do you already use one of these tools or maybe even tried both in your project? Please, share a couple of thoughts on use cases and why you preferred one over another as it might be very helpful to someone who is staying on a performance tools crossroad right now.
Published at DZone with permission of Yuri Bushnev, DZone MVB. See the original article here.
Opinions expressed by DZone contributors are their own.

Comments