JMeter Distributed Testing with Docker
Distributed testing allows developers to perform multiple tests using the same JMX script in a containerized environment using Docker.
Join the DZone community and get the full member experience.
Join For FreeThe Docker platform and its services are digital innovations that are part of a radical change that is going on in the IT industry. By giving performance testers and developers fast access to testing and development tools, testers can do more, in less time and in a more creative manner.
This blog post will focus on using Docker with open source Apache JMeter™ for creating a distributed testing scenario. To learn the basic way to run JMeter with Docker, check out our previous blog post "Make Use of Docker with JMeter - Learn How".
What is "distributed testing"? Distributed testing means that a test is split into several parts and each of these parts can be performed over a network on a separate machine (physical or virtual). The term "distributed" doesn't necessarily mean a simultaneous execution of the test, because there is the handling of coordination and synchronization that are needed to properly administer each part (e.g. start, stop, report, etc).
With JMeter, distributed testing is based on the client-server model, where two kinds of JMeter instances interact over the network to perform one JMX test script. The first kind of JMeter instance is called the client. The JMeter client instance is the centralized injector of test session. This instance is the main controller that decides which JMX script is executed and when.
For various reasons (e.g. limitation of local resources, network firewall) the client distributes load generation to other JMeter instances, called servers. The JMeter servers are "distributed" over the network. They receive the JMX script to be executed from the client.
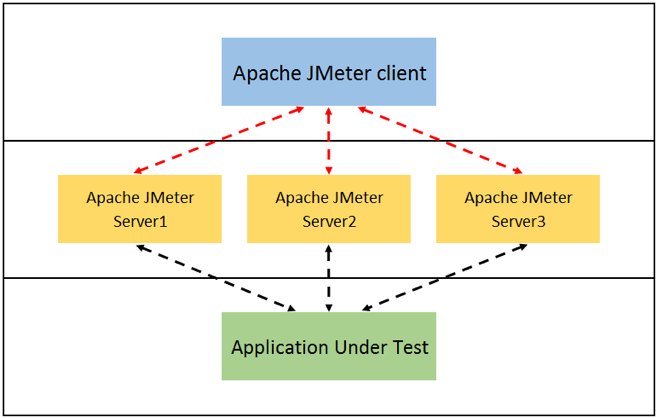
The "Network" connects all JMeter instances carrying controlling messages among instances. Not only is the JMX script transmitted over the network, but also asynchronous messages that occur during execution (e.g. sampling data, stop command, etc).
For a detailed description of a JMeter distributed testing setup and its usage, read the blog post "How to Perform Distributed Testing in JMeter". But the setup for distributed testing can be a tricky and error-prone procedure, based on the properties file and the command line. So why not to drastically reduce the setup complexity, by using Docker?
When our designed application is not located on one container but it is composed by many, it is important to understand how to organize them in a Docker network.
By default, Docker virtualizes the container network interface on a network called bridge. All containers can communicate with each other like on a local area network, without any restriction.
Consider the following scenario: our Docker machine hosts many docked applications and each application is composed by many Docker containers. But what happens if we have a bug? How could we analyze it with so many containers running and communicating with each other? In this situation it is convenient to manage each Docker application by using networking isolation.
With network isolation, Docker simulates a working network for each application. Each container that belongs to a network cannot communicate with containers from another network. For bug analysis, network isolation is useful because it enables us to ignore effects generated by other Docker networks (or applications).
The basic command to setup the network is:
docker network <arguments>
There are many possible network configurations. For example, it is possible to configure a container:
- without any network interface using a special docker network called none.
- on a host machine network interface using a docker network called host.
An important note for Docker toolbox users: the Docker host machine is a VirtualBox machine running on a local physical machine. Every behaviour related to bridge and host Docker networks should be related to the virtual machine (e.g. the container placed on the host network cannot be reached on the local physical machine address (lan ip, 127.0.0.1 or localhost) without a forwarding port on the VirtualBox). For further details/examples on the Docker network, see this link.
In this article, the interaction with the Docker network is based on the following command/arguments:
|
Docker performs integrity checks when the commands above are executed. For example, when trying to assign an invalid IP address for the selected subnet or trying to remove a Docker network that has a running container, error messages will be received and the command will not be performed. Moreover, Docker allows inserting/removing a running container into/from a network with a similar result to plugging/unplugging a network cable from a switch.
In this section we will be presenting a practical example, starting from the JMeter Docker image we prepared in the previous blog post.
In this scenario, Docker virtualizes a local network that links to all JMeter containers. The Docker network used in this article:
- does not restrict packet exchange among containers
- allows containers' communication without any proxy in the middle
- isolates containers from being contacted externally
- allows containers to be reached externally
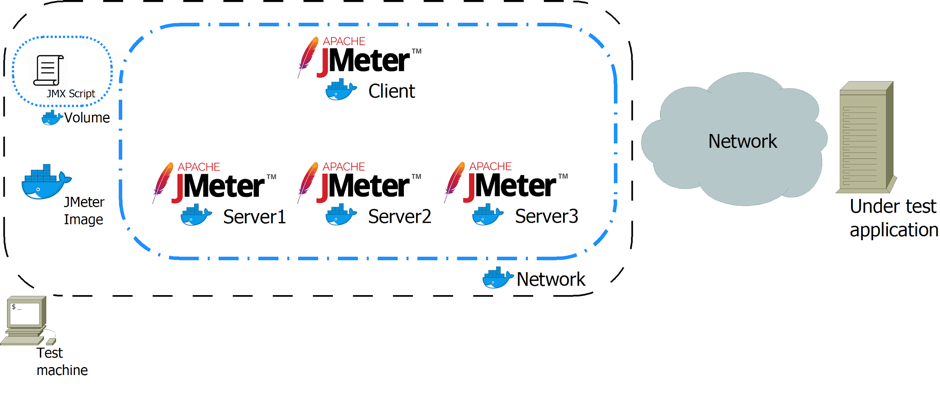
With our "jmeter" Docker image we can launch a container running a single JMeter instance. The JMeter instance can be customized with additional arguments in the Docker run command (e.g. JMeter arguments and JMeter properties redefinition). Consequently, by using the Docker run command it is possible to assign roles in our docked application.
Bash
#!/bin/sh
#1
SUB_NET="172.18.0.0/16"
CLIENT_IP=172.18.0.23
declare -a SERVER_IPS=("172.18.0.101" "172.18.0.102" "172.18.0.103")

#2
timestamp=$(date +%Y%m%d_%H%M%S)
volume_path=$(pwd)
jmeter_path=/mnt/jmeter
TEST_NET=mydummynet

#3
echo "Create testing network"
docker network create --subnet=$SUB_NET $TEST_NET


#4
echo "Create JMeter servers"
for IP_ADD in "${SERVER_IPS[@]}"
do
docker run \
-dit \
--net $TEST_NET --ip $IP_ADD \
-v "${volume_path}":${jmeter_path} \
--rm \
jmeter \
-n -s \
-Jclient.rmi.localport=7000 -Jserver.rmi.localport=60000 \
-j ${jmeter_path}/server/slave_${timestamp}_${IP_ADD:9:3}.log
done


#5
echo "Create JMeter client"
docker run \
  --net $TEST_NET --ip $CLIENT_IP \
  -v "${volume_path}":${jmeter_path} \
  --rm \
  jmeter \
  -n -X \
  -Jclient.rmi.localport=7000 \
  -R $(echo $(printf ",%s" "${SERVER_IPS[@]}") | cut -c 2-) \
  -t ${jmeter_path}/<jmx_script> \
  -l ${jmeter_path}/client/result_${timestamp}.jtl \
  -j ${jmeter_path}/client/jmeter_${timestamp}.log

#6
docker network rm $TEST_NET
This shell script must be launched into the folder where the <jmx_script> is located, so distributed testing executes this jmx script. Moreover, the Docker host must have the Docker image called "jmeter" described in previous article.
Here is a description of the shell script steps.
Step #1 defines:
- a working subnet
- a client instance IP address
- server IP addresses (and relatively a number of server instances)
Step #2 is defines:
- the timestamp label used for result files
- the volume path on the hosting machine
- how the volume path is seen by the containers
- the name of docker network used during the test
Step #3 creates a new Docker network by using the chosen subnet and assigning it with a name (in our example "mydummynet"), which will be used to reference this network.
Step #4 creates all JMeter server containers looping over the "SERVER_IPS" array. Each server container is configured to be:
- running in the background and interactively (-dit)
- attached to the created docker network with a specific ip address (--net and --ip)
- mapping a docker volume in the container path "/mnt/jmeter" (-v)
- removed when the container ends it execution (--rm)
- based on the image "jmeter" (see previous article)
- a JMeter instance in no-gui mode (-n) and in server mode (-s)
- engaged in distributed testing using specific client/server ports (-Jclient.rmi.localport=7000 -Jserver.rmi.localport=60000)
- capable to write JMeter instance log into the docker volume mapped folder (-j)
Step #5 creates a JMeter client container and is configured to be:
- attached to the created docker network with a specific ip address (--net and --ip)
- mapping a docker volume in the container path "/mnt/jmeter" (-v)
- removed when the container ends its execution (--rm)
- based on the image "jmeter" (see previous article)
- a JMeter instance in no-gui mode (-n) and stops contacting servers when test execution ends (-X)
- listening on port 7000 for distributed testing (-Jclient.rmi.localport=7000)
- looking for JMeter server list passed (-R)
- running the jmeter script located in "/mnt/jmeter" path (-t) and writing result on file (-l)
- capable to write the instance log into the docker volume mapped folder (-j)
Step #6 is executed at the end of the distributed testing to remove the Docker network. This step will fail if any running container is still attached to the network. In this manner this step can be used as a sort of check to ensure that all containers successfully completed their execution.
In this example, the Docker volume is used to provide the <jmx_script> to the JMeter client instance. Moreover, it can be used as shared folder among all the containers in the distributed application. By using the Docker volume usage it's possible to provide additional file resources in a transparent manner to each JMeter server instance (e.g. CSV file, Java KeyStore, etc..).
At the end of the distributed testing execution, two sub-folders with files generated by the docked application are added to the folder where the bash script is executed:
- In the "server" folder there are JMeter server instances logs, organized by timestamps and ip addresses. Normally, these files are read when an application error occurs (e.g. network or memory problem, missing dependencies, etc.)
- In the "client" folder there is the JMeter result file (jtl) aggregated by all the server instances used. There is also a JMeter client instance log, which is useful for analyzing execution errors.
Running a JMeter Single Instance vs. JMeter Distributed Testing
Here is a comparison of the execution of two containers. The comparison is based on a standard output from a JMeter instance running on the container. Both containers are testing the same jmx script, with the only difference being the running mode: a single instance vs. distributed testing.

In single mode, as usual for non-gui mode, you can see how the test proceeded with aggregated statistics. Take note that the sampling rate is 10 msg/s and there are 5 running threads.
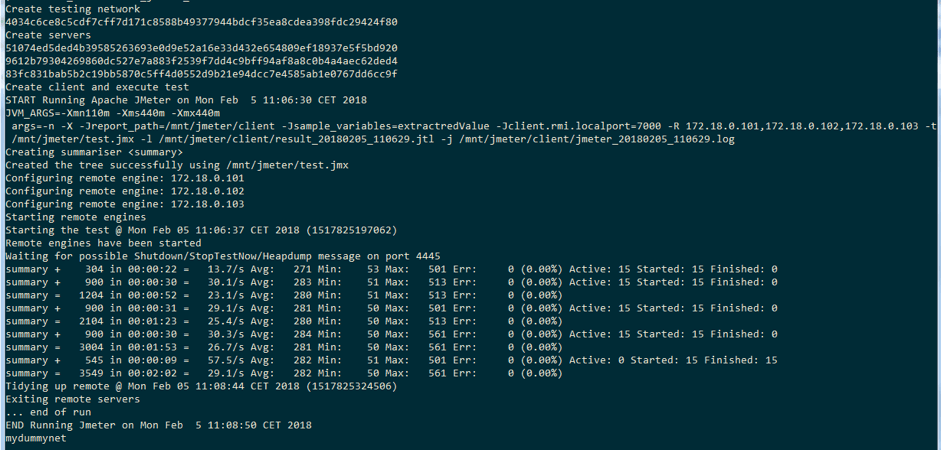
In the distributed testing mode, we are examining a standard output of JMeter client instance. This output shows that client configured each "remote" server and invoked execution of a jmx script to all of them.
In the aggregated statistics part it is visible that the reached rate is close to 30 msg/s and there are 15 running threads. Compared with the single instance execution, the multiplication factor is the result of the number of JMeter servers (three in this example).
It's important to focus the reader that each server instance receives the same jmx script and executes it independently from the others. Consequently, the JMeter client, by collecting data from servers, reports aggregate statistics with a total load higher compared to the value coded into the original test script. When we are planning a performance test with JMeter in distributed testing mode, it's necessary to take care of the multiplication factor and adjust the JMX script consequently.
How to Use Docker-Compose
As seen in this article, we have handled a virtualized application composed by multiple containers interconnected. The Docker suite offers a tool that simplifies the handling of multiple containers called docker-compose.
The scope of docker-compose is to centralize and make the multi containers setup portable, by using a unique yaml file. This file describes:
- how each container is executed and in which order
- how to setup the network and which host name can be used to resolve the container ip address
- how to setup volumes and how they are seen by containers
With docker-compose, it is possible to easily define an automatic testing environment. This environment is portable across the Docker based hosting infrastructure (e.g. local machine, cloud provider, etc).
This section will show how to use our distributed example but by using docker Compose instead of the complete shell script approach.
First, we need to install docker-compose from this link. After installation, docker-compose is available on the command line. Below is a standard output example (versions may differ).

Now, we will define a YAML file that will setup the JMeter server instances.
YAML
version: '3'

services:
  slave-1:
image: jmeter
volumes:
 - .:/mnt/jmeter
command: -s -n -Jclient.rmi.localport=7000 -Jserver.rmi.localport=60000
  slave-2:
image: jmeter
volumes:
 - .:/mnt/jmeter
command: -s -n -Jclient.rmi.localport=7000 -Jserver.rmi.localport=60000
  slave-3:
image: jmeter
volumes:
 - .:/mnt/jmeter
command: -s -n -Jclient.rmi.localport=7000 -Jserver.rmi.localport=60000
This file defines explicitly:
- three containers uses as the starting point of our jmeter image
- each container has a volume that maps the current path in "/mnt/jmeter" on to the container
- The JMeter command line required to execute server instances
Moreover this file defines implicitly:
- the creation of a docker network based on a bridge driver only for the containers described
- a container address resolution based on the name described in the file
Save this file with the name "docker-compose.yml" and launch the command:
docker-compose up
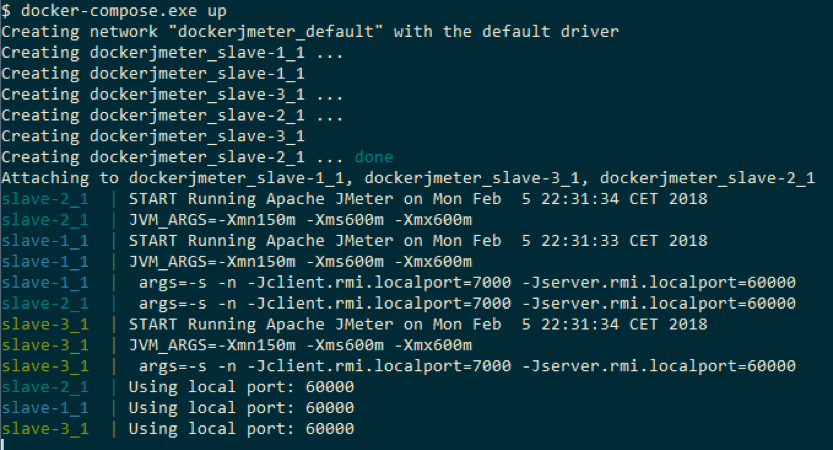
This single command executes various effects:
- parses the yaml file for its correctness
- generates the docker network ad-hoc
- starts three containers using the description provided
- attaches the just created containers to the docker network
In the command standard output it is possible to see the name of the created network, "dockerjmeter_default", and that the three containers started successfully.
Now, via the shell command we invoke the docker run for the JMeter client instance as already seen above, and consequently start distributed testing.
The next command is almost completely equal to the one we already saw. There are two modifications:
- The container is attached to the network created with "docker-compose" command
- The JMeter server list (-R) is filled with the names of the containers as described in the yaml file
Bash
docker run \
  --net dockerjmeter_default \
  -v "$(pwd)":/mnt/jmeter \
  jmeter \
  -n -X \
  -Jclient.rmi.localport=7000 \
  -R slave-1,slave-2,slave-3 \
  -t /mnt/jmeter/test.jmx \
  -l /mnt/jmeter/compose/result.jtl \
  -j /mnt/jmeter/compose/jmeter.log
The standard output of the JMeter client container is:
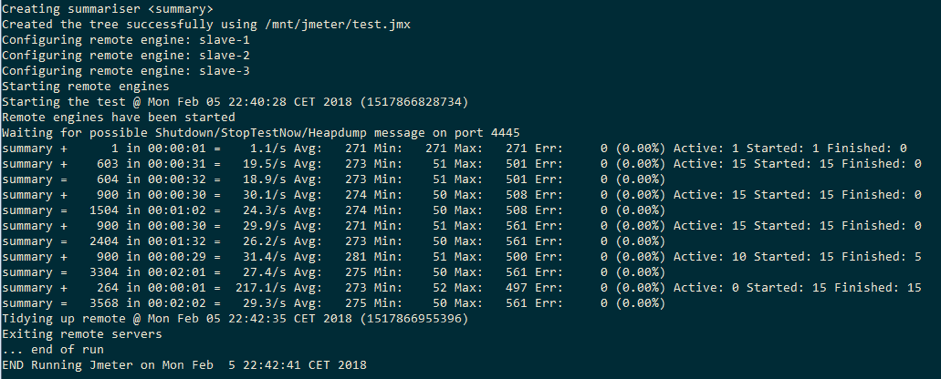
The above standard output is from the JMeter client execution. This output shows that the resolution of the JMeter servers is based on the name contained in the yaml file instead of on the ip address as shown into bash example. The remaining part of standard output is equal to the example based on the shell script.
All the example files described both in this article and first one are available on the github repository.
The example in this article is based on Apache JMeter 3.3. Recently a new major version JMeter version was released, version 4.0, which introduces an important change for distributed testing settings. The default communication between the client and servers is now based on a secure RMI channel and requires a keystore.
By using the JMeter 4 version, our example will fail with an error like this:

To adapt our example to JMeter 4 there are two possible ways to go:
- Quick and dirty - disable the secure channel among client and servers. This solution can be appropriate when all servers work on a private network, where no external access is guaranteed.
- Secure our channel, generate a Java keystore and provide it to each JMeter instance - This solution should be taken into account when some (or all) of our server instances are located on a public network and potential external access can be used to execute malicious code.
"Quick and dirty" is a workaround that disables the secure channel and potentially exposes our servers to the risk of malicious code execution:
- Modify "
JMETER_VERSION" in the Dockerfile to "4.0" - Build a newer image version with the "docker build" command
- Disable the secure RMI adding "
-Jserver.rmi.ssl.disable=true" on each instance
An example of the final code can be see here.
"Secure our channel" is the suggested procedure to setup distributed testing with JMeter:
- Modify "
JMETER_VERSION" into Dockerfile to "4.0" - Build a newer image version with the "docker build" command
- From the JMeter 4.0 installation, execute the "
create-rmi-keystore" command located inside the "bin" folder, as described here - We now have a file "
rmi_keystore.jks" that should be placed into the docker volume folder (the one that contains our "test.jmx" file) - Server instances will be executed with the arguments "
-Jserver.rmi.localport=60000" and "-Jserver.rmi.ssl.keystore.file=${jmeter_path}/rmi_keystore.jks" - The client instance will be executed with the argument "
-Jserver.rmi.ssl.keystore.file=${jmeter_path}/rmi_keystore.jks"
An example of the final code can be see here.
We have seen in this article that Docker is like a swiss-knife for test automation with a multitude of setup and facilities. As we have already seen in the first article, we can reuse a known container many times by producing new running configurations and different final applications. Moreover, by using Docker we can easily focus on business goals and save time otherwise spent on minor setup steps/issues (e.g. Java version, JMeter version, port configuration communications, etc). We have also seen docker-compose, which drastically simplifies multi container setup/usage and introduces other facilities like the address name resolution for container.
But we have only scratched the surface and so the writer wants to leave a tip for future extensions of the described application. In the article example it is assumed that servers can reach under test applications without any additional network configuration. But in some cases it is necessary to dedicate a proxy container to forward traffic generated by our docked application.
An example to adopting a proxy container can be related to the test environment. Suppose our test script is planned to be executed on more test environments (e.g. dev, test, pre-prod, etc.). When our docker application is executed, the proxy is configured according to the test environment, by using its docker run command. All containers ignore the environment that is really tested but they know the proxy forwards the generated traffic correctly. So by adding one proxy container to our docker application we can increase portability and reusability.
If you need to run JMeter in the cloud, try out BlazeMeter. BlazeMeter provides you with:
- Simple Scalability - It's easy to create large-scale JMeter tests. You can run far larger loads far more easily with BlazeMeter than you could with an in-house lab.
- Rapid-Start Deployment - BlazeMeter's recorder helps you get started with JMeter right away, and BlazeMeter also provides complete tutorials and tips.
- Web-Based Interactive Reports - You can easily share results across distributed teams and overcome the limitations of JMeter's standalone UI.
- Built-In Intelligence - The BlazeMeter Cloud provides on-demand geographic distribution of load generation, including built-in CDN-aware testing.
To try us out, request a demo!
Published at DZone with permission of Vincenzo Marrazzo, DZone MVB. See the original article here.
Opinions expressed by DZone contributors are their own.

Comments