Java Collection Performance
Learn more about Java collection performance in this post.
Join the DZone community and get the full member experience.
Join For Free
The performance of data structures, especially collections, is a recurrent subject when coding. If you have never heard about such a topic, here is your chance. Otherwise, it’s the hundredth time you'll have seen such a title, and you are probably thinking: “Another article about this topic? I’ll probably learn nothing new." You may be surprised! We cover a lot in this post with captivating graphs, charts and more. Let's get started!
You may also like: Iteration Over Java Collections With High Performance
My First Encounter With Collection Performance
The first time I started wondering about collection performance was when I started working with over 100,000 elements collections. At that time, I heard some bad jokes such as “I just understood why the Java logo is a cup of coffee because Java collections are so slow that when manipulating them, you have the time to go and grab some coffee before they do the job… Just kidding!”
At that time, I wanted to use an implementation of java.util.List that would have great performance on all the common methods provided by the interface (let’s say get(index), add(Object), remove(Object), remove(index), contains(Object), iterator(), add other methods that you like), without wondering about memory usage (I mean, even this List would take 4 times the size of a LinkedList it wouldn’t be a big deal).
In other words, some List that would not be instantiated a million times in my application, but a couple of times, and each instance will have great performances. For example, the model of a GUI Table, or some other GUI component, which data will evolve frequently, and which performances will sometimes be critical.
First of all, what do I mean by good performance? Usually, good performance is equivalent to an average complexity in O(1). But this one is impossible to get all the time, so first, let’s study current JDK List/Collection implementations and see what we have.
Current JDK List/Collection Implementations
Well, we already know basic information about collection methods and their complexity, such as the fact that a HashSet has an average O(1) complexity for its contains(o) method, or that ArrayList is also in O(1) for its method get(int index), etc.
But it will take some time to study the entire JDK Collection API to have an idea of the complexity of each implementation (sometimes, the complexity is not really explicit), so instead of that, let’s conduct a basic benchmark to see what they are capable of:
    private void execute(BenchRunnable run, int loop, String taskName) {
        System.out.print(taskName + " ... ");
        // set default context
        collection.clear();
        collection.addAll(defaultCtx);
        // warmup
        warmUp();
        isTimeout = false;
        // timeout timer
        Timer timer = new Timer((int) timeout, new ActionListener() {
            @Override
            public void actionPerformed(ActionEvent e) {
                isTimeout = true;
                // to raise a ConcurrentModificationException or a
                // NoSuchElementException to interrupt internal work in the List
                collection.clear();
            }
        });
        timer.setRepeats(false);
        timer.start();
        long startTime = System.nanoTime();
        int i;
        for (i = 0; i < loop && !isTimeout; i++) {
            try {
                run.run(i);
            } catch (Exception e) {
                // on purpose so ignore it
            }
        }
        timer.stop();
        long time = isTimeout ? timeout * 1000000 : System.nanoTime() - startTime;
        System.out.println((isTimeout ? "Timeout (>" + time + "ns) after " + i + " loop(s)" : time + "ns"));
        // restore default context
        // the collection instance might have been corrupted by the timeout,
        // create a new instance
        try {
            Constructor<? extends Collection> constructor = collection.getClass().getDeclaredConstructor(
                        (Class<?>[]) null);
                constructor.setAccessible(true);
                collection = constructor.newInstance();
            collection = collection.getClass().newInstance();
            // update the reference
            if (collection instanceof List) {
                list = (List<String>) collection;
            }
        } catch (Exception e1) {
            e1.printStackTrace();
        }
        // gc to clean all the stuff
        System.gc();
    }
For that purpose, I wrote this very simple benchmark code, that is not very elegant — I have to admit — but did do the trick. Below is the core of the benchmark:
This is where the BenchRunnable is just like a Runnable, which can use the current loop index:
    private interface BenchRunnable {
        public void run(int loopIndex);
    }
And the warmUp() method will manipulate the collection to be sure that the internal structure is allocated.
A timer is used to timeout too long method benchmarks. Indeed, my purpose is not to have a complete benchmark, but just a global idea of what implementations of Collection are efficient for a given method.
For example, I will call this method this way:
    int nb = 1000000;
    final List<String> list = new LinkedList<String>();
    execute(new BenchRunnable() {
        @Override
        public void run(int i) {
            list.add(Integer.toString(i));
        }
    }, nb, "add " + nb + " distinct elements : ");
I will finally display the results in a JFreeChart component because the console output is not very friendly to compare results.
The complete source of the Benchmark class can be found here — feel free to play with it! (To those who will think: “You should have used a proper tool to do this stuff,” I would reply with: “Yes, you’re totally right, but the fact is that when I started it, I didn’t mean for it to be so big in the end. Anyway, I like the press-button execution …”).
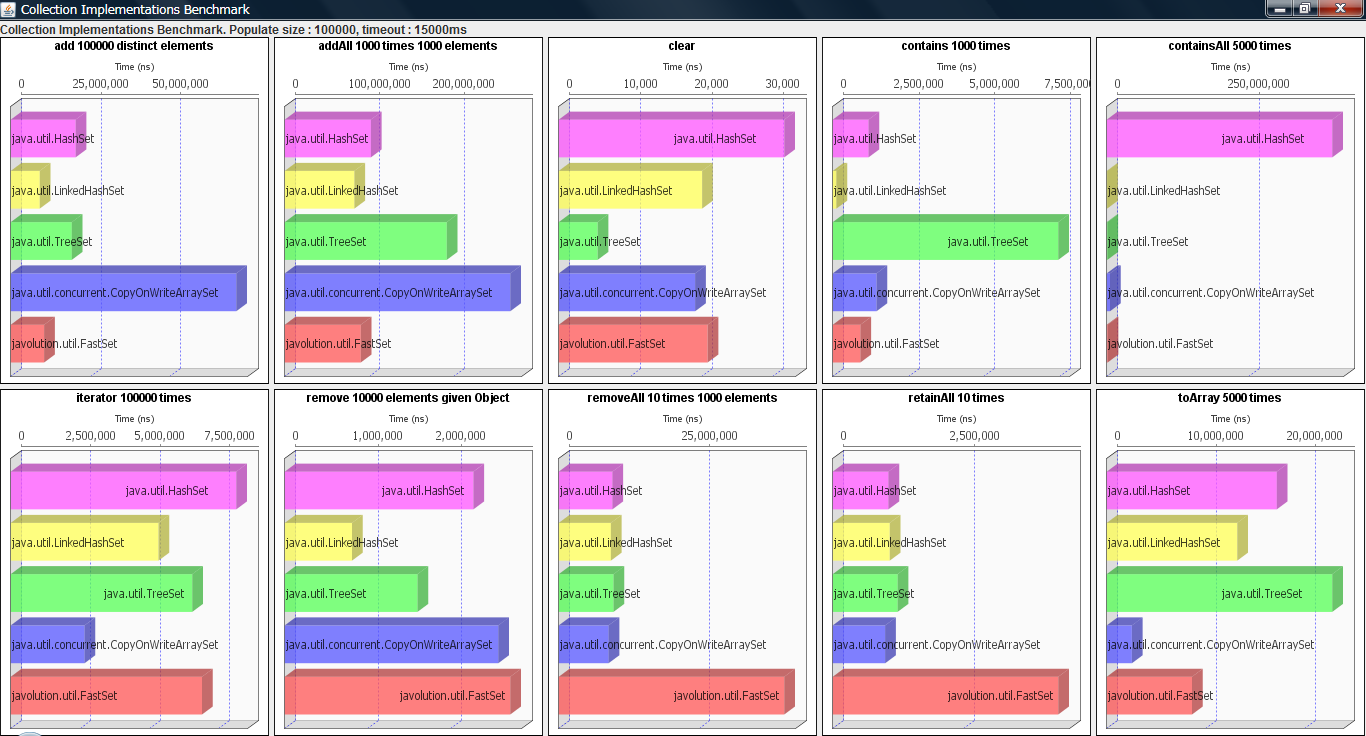
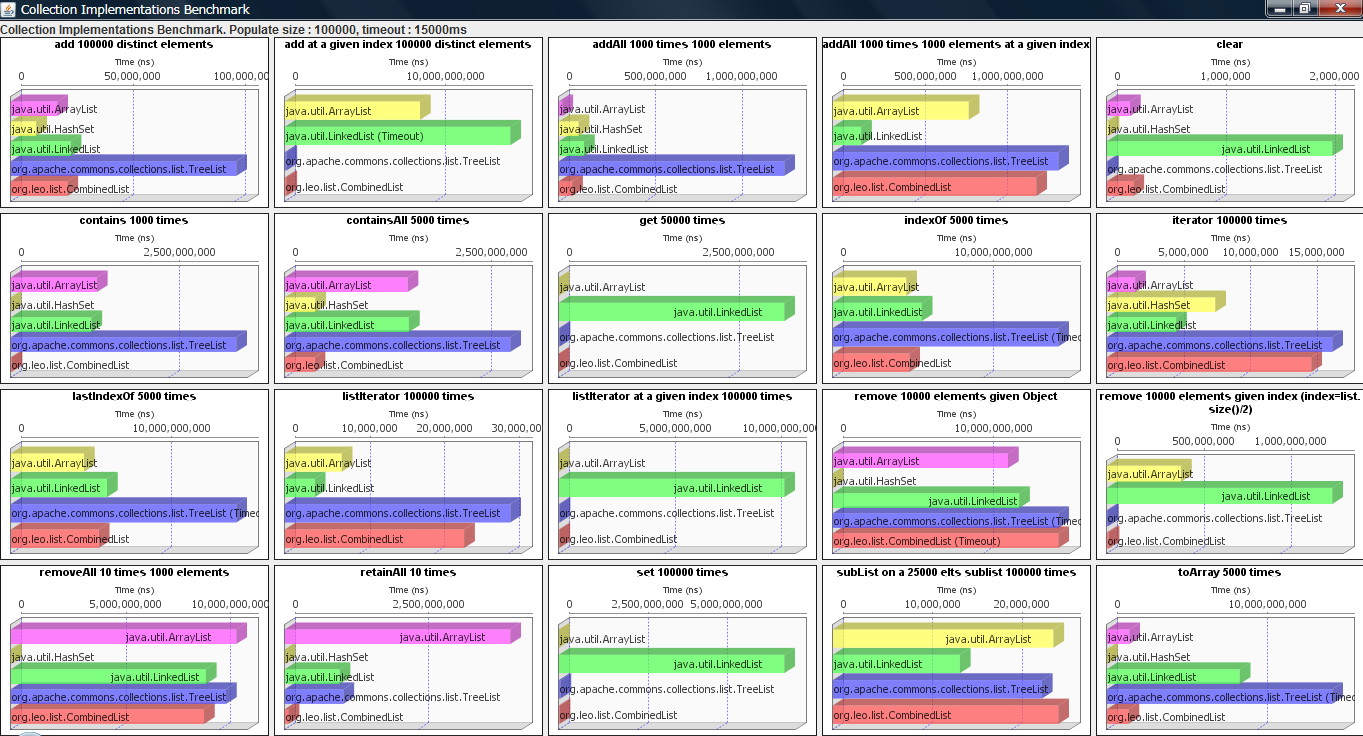
I first launched it on a couple of famous lists, from the JDK, from Javolution, from Apache Commons. I also added a HashSet, just for the records. Here is what I got (the colorful charts that I promised you) (Note that every bench is done with an instance of the given collection populated with 100,000 elements):
We can see some interesting things here; we confirm what we already knew about some collections, the CopyOnWriteArray is significantly slow on data modification, etc.
We also can see, between ArrayList and LinkedList, some significant differences (OK, the benchmark does not cover all the different cases, and maybe we are in the particular case were ArrayList is better than LinkedList. Anyway, it gives us an interesting view overall).
The point here is to talk about List, especially fast implementations, but for the record, I posted the results I got for some Sets below:
CombinedList
So, after tuning the benchmark a little bit and studying my charts, I thought: “How about creating my humble but own implementation of List?” This is with a simple idea, not by implementing some cute-edge algorithm, but just by combining existing implementations. (If you’re not very enthusiastic about this idea, you can go directly to the Memory Usage of Collections section below).
By this, I mean a CombinedList, which will use internally a HashSet, an ArrayList, and a TreeList, and in each of its method, will use the data structure the most efficient to do the job, and so my CombinedList will be almost as fast as the fastest collection for all of its methods.
By almost, I mean there will be a little delay involved by the fact that we will sometimes need to synchronize the data in the internal collections. But it’s not a big deal because the clear() and addAll(collection) methods are quite fast, as we saw in our first charts, and they are definitely faster than some other O(n) or O(n x n) operations on some collections.
So it’s faster to recreate from scratch the all of the collection rather than applying a remove(Object) on an ArrayList (once again, here, I don’t care about memory).
Here are the attributes of my CombinedList:
    /** HashSet */
    private HashSet<E> hashSet;
    /** ArrayList */
    private ArrayList<E> arrayList;
    /** TreeList */
    private TreeList treeList;
    /** If hashSet is up-to-date */
    private boolean isHashSetUpToDate = true;
    /** If arrayList is up-to-date */
    private boolean isArrayListUpToDate = true;
    /** If treeList is up-to-date */
    private boolean isTreeListUpToDate = true;
After that, in each method, I will use the fastest collection. For example, the contains(o) has an average O(1) in the HashSet implemetation, so:
/**
 * @see java.util.Collection#contains(java.lang.Object)
 */
@Override
public boolean contains(Object o) {
    // most efficient is HashSet
    updateHashSetIfOutOfDate();
    return hashSet.contains(o);
}
Where the updateHashSetIfOutOfDate() will be coded like this:
    /**
     * Update the hashSet if out of date
     */
    private void updateHashSetIfOutOfDate() {
        // one of the two collection arrayList or treeList is necessarily up-to-date
        if (!isHashSetUpToDate) {
            hashSet.clear();
            if (isArrayListUpToDate) {
                hashSet.addAll(arrayList);
            } else {
                hashSet.addAll(treeList);
            }
            isHashSetUpToDate = true;
        }
    }
Concerning data modification, we will do a similar trick:
    /**
     * @see java.util.List#set(int, java.lang.Object)
     */
    @Override
    public E set(int index, E element) {
        modCount++;
        // most efficient is ArrayList
        updateArrayListIfOutOfDate();
        E old = arrayList.set(index, element);
        setOtherThanArrayListOutOfDate();
        return old;
    }
Where setOtherThanArrayListOutOfDate() will look like:
    private void setOtherThanArrayListOutOfDate() {
        isHashSetUpToDate = false;
        isTreeListUpToDate = false;
    }
We’ll extend java.util.AbstractList, and don’t forget to increment modCount when changing internal data so that the ConcurrentModificationException mechanism is inherited from it.
Finally, we’ll do some custom optimization on the retainAll(Collection) as mentioned on this Java bug.
And we are done, the complete source of the CombinedList class can be found here.
And here are the benchmark results:
We are quite good on contains(Object) and containsAll(Collection) thanks to the HashMap, and we are good on remove(Object) and add(int, Object) thanks to TreeList (TreeList is in O(log n) for these operations).
Memory Usage of Collections
Ok, I said that I didn’t care about memory, but let’s take a look at the size of CombinedList, and at the same time, let's look at the size of other collections.
For that purpose, and as I still don’t want to use Yourkit profiler today (which is an excellent tool by the way), I just added some simple method to measure our collection size:
heavyGc();
long usedMemory = ManagementFactory.getMemoryMXBean().getHeapMemoryUsage().getUsed();
Constructor<? extends Collection> constructor = clazz.getDeclaredConstructor((Class<?>[]) null);
constructor.setAccessible(true);
// do the test on 100 objects, to be more accurate
for (int i = 0; i < 100; i++) {
    this.collection = (Collection<String>) constructor.newInstance();
    // polulate
    collection.addAll(defaultCtx);
    // do some operation to be sure that the inernal structure is allocated
    warmUp();
}
// measure size
long objectSize = (long) ((ManagementFactory.getMemoryMXBean().getHeapMemoryUsage().getUsed() - usedMemory) / 100f);
System.out.println(clazz.getCanonicalName() + " Object size : " + objectSize + " bytes");
collection.clear();
collection = null;
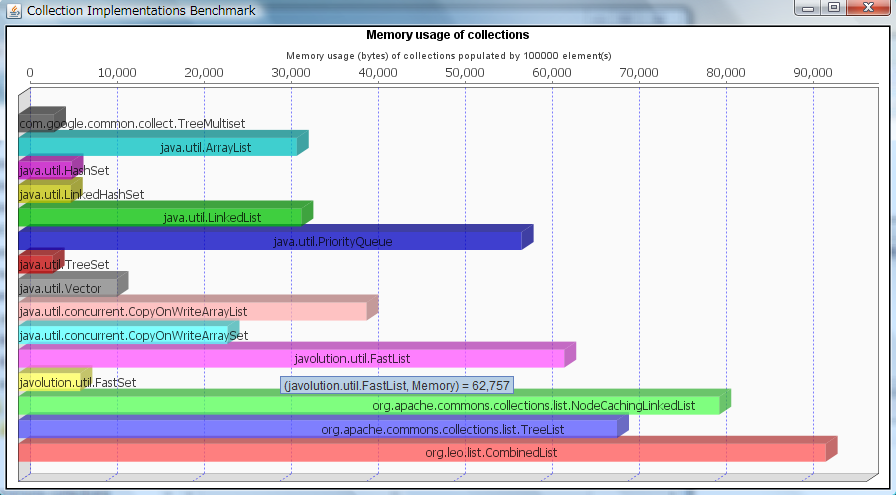
Let's display the results in the same JFreeChart component:
Ok, we have what we were expecting, that is to say, our CombinedList size a TreeList + an ArrayList + a HashSet, but it is not so bad compared to our other collections! Ok, yes it is, but with good performance!
What About JIT Compilation? Will Heap Allocation Impact the Benchmark?
Just a final remark concerning the benchmark. Does the fact that all benchmarks are completed in the same JVM impact the results? The answer (correct me if I'm wrong) is that, if I executed each method one time, and if the methods were very fast, the JIT compilation time could have an impact on the performance measured on the first Collections tested. That's the reason why, in my benchmark, I first tested the CombinedList to be sure to have the worst-case performance.
But the fact is that we execute several (thousands of times) of the same methods, so I consider the JIT compilation time to be negligible.
Also, what about heap allocation and status? And its impact on the test? For this purpose, I carefully freed all objects at the end of each collection benchmark and called a heavyGc() to be sure to minimize this matter.
private void heavyGc() {
    try {
        System.gc();
        Thread.sleep(200);
        System.runFinalization();
        Thread.sleep(200);
        System.gc();
        Thread.sleep(200);
        System.runFinalization();
        Thread.sleep(1000);
        System.gc();
        Thread.sleep(200);
        System.runFinalization();
        Thread.sleep(200);
        System.gc();
    } catch (InterruptedException ex) {
        ex.printStackTrace();
    }
}
Yes, this is a HEAVY GC.
Thanks for reading!
This post was originally published here.
Opinions expressed by DZone contributors are their own.

Comments