Investigating a Memory Leak in Entity Framework Core
Memory dumps don't lie — if you have a memory leak, look at the evidence before you.
Join the DZone community and get the full member experience.
Join For Free
The terms "memory leak" and ".NET application" are not used together very often. However, we recently had a spate of out of memory exceptions in one of our .NET Core web applications. The issue turned out to be caused by a change in behavior in Entity Framework Core, and whilst the eventual solution was incredibly simple, the journey to get there was both challenging and interesting.
The system itself is hosted in Azure and is comprised of an Angular SPA front-end and a .NET Core API on the back-end, using Entity Framework Core to talk to an Azure SQL Database. As a software consultancy specializing in .NET development, we've written many similar applications before.
You may also like: How to Diagnose Memory Leaks.
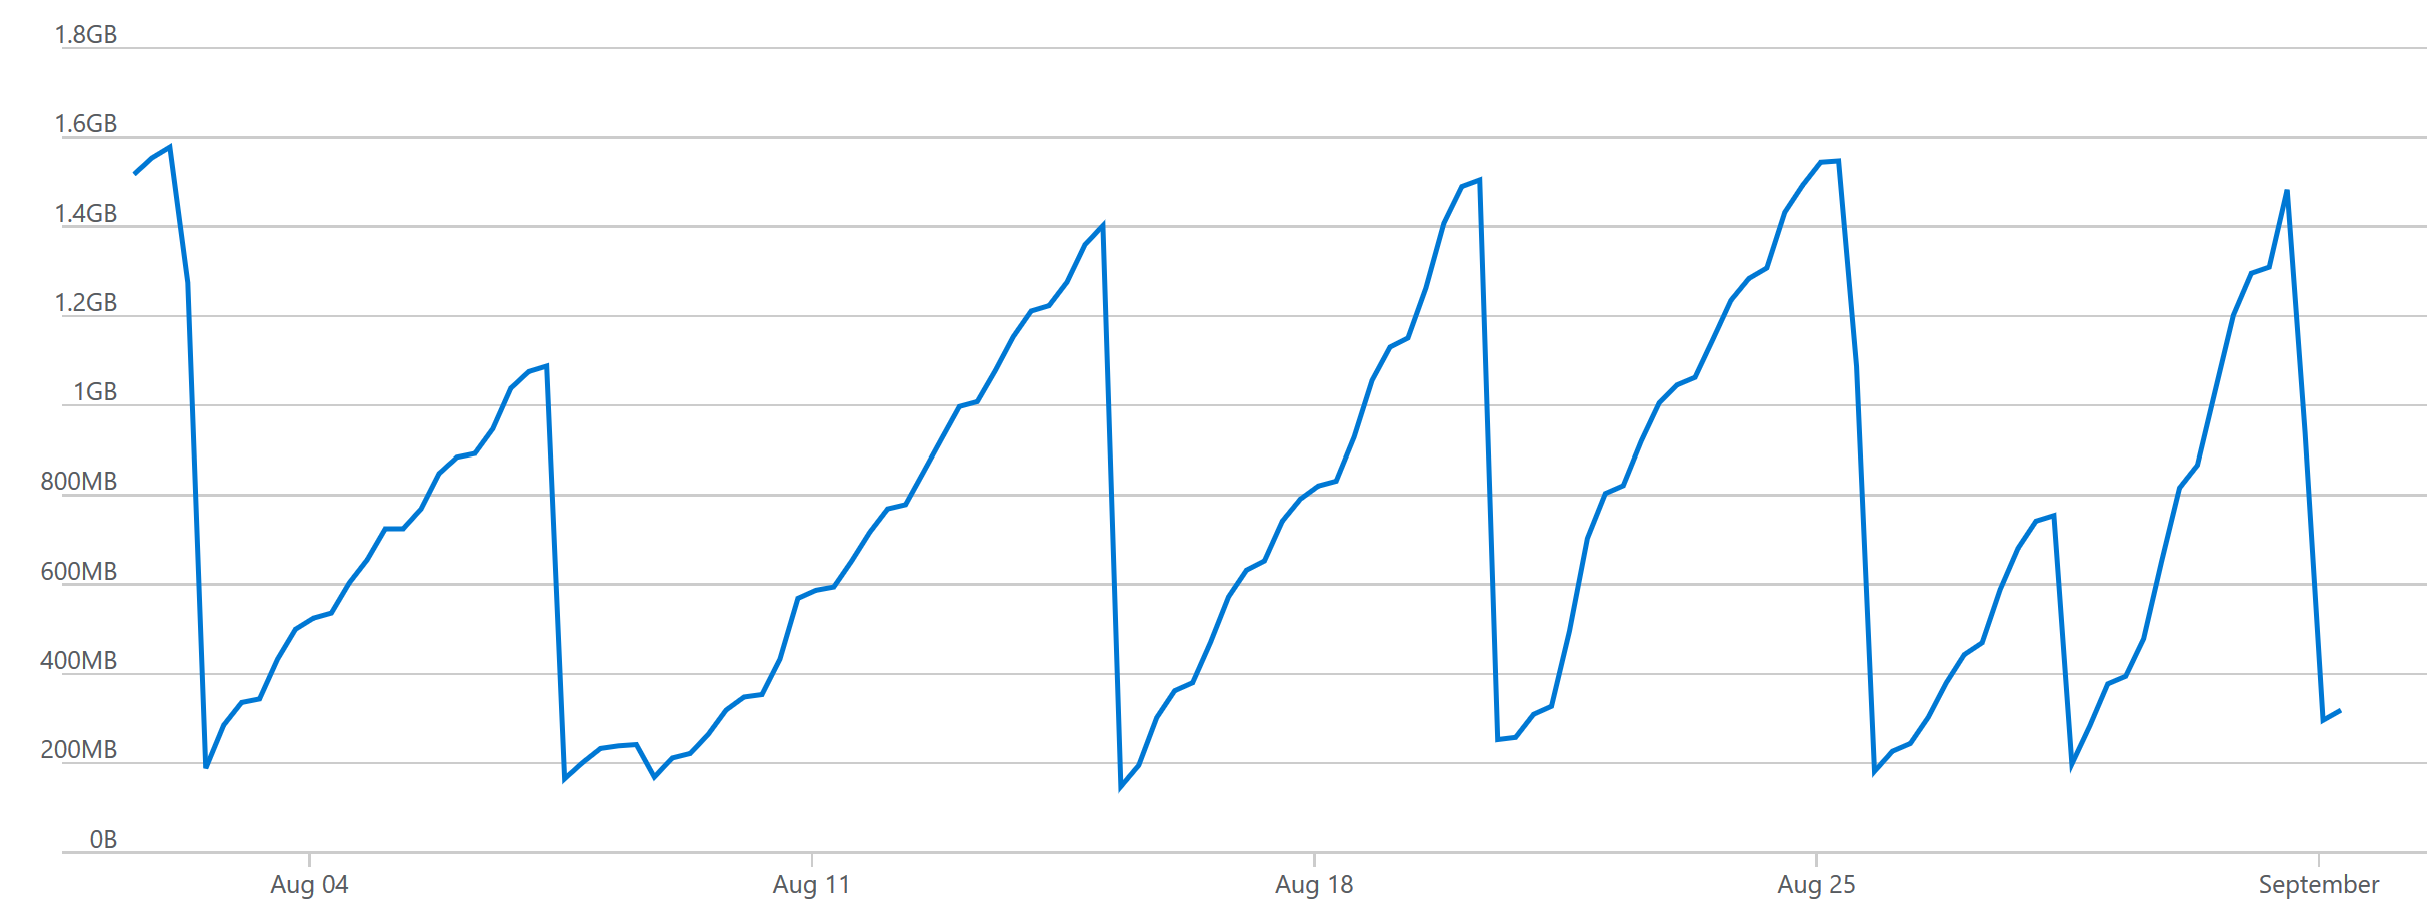
The out of memory crashes were therefore not expected, so we immediately knew that this was something that needed to be taken seriously. Using the metrics in the Azure Portal, we could see the steady increase in memory usage, followed by an abrupt drop-off: this drop-off is the app crashing.

So, we spent some time investigating and incrementally making changes to resolve what looked like a classic memory leak. A common cause of leaks in .NET is something not being disposed of properly, most likely an EF Core database context in our case. So, we went through the source code looking for potential reasons that the context might not be disposed of. This turned up a blank.
We upgraded Entity Framework Core to the latest version as most recent updates included fixes for various memory leaks and general efficiency improvements.
We also found out about a possible memory leak in the version of Application Insights we were using (see https://github.com/microsoft/ApplicationInsights-dotnet/issues/594), so we upgraded that package as well.
None of this solved the problem, so we dissected a memory dump we'd taken from the Azure App Service (see https://blogs.msdn.microsoft.com/jpsanders/2017/02/02/how-to-get-a-full-memory-dump-in-azure-app-services/).
We noticed that the vast majority of managed memory was ultimately being used by the MemoryCache class; drilling down a bit further revealed the fact that a majority of the cached data was in the form of raw SQL queries. We saw a huge number of occurrences of what was fundamentally the same query being cached multiple times, with parameters hardcoded in the query itself rather than being parameterized.
For example, rather than caching a query like this:
SELECT TOP (1) UserId, FirstName, LastName, EmailAddress
FROM Users
WHERE UserId = @param_1
we were finding multiple queries like this:
SELECT TOP (1) UserId, FirstName, LastName, EmailAddress
FROM Users
WHERE UserId = 5
So, we did some searching around for EF Core issues that might be related and came across this issue: https://github.com/aspnet/EntityFrameworkCore/issues/10535.
The thread on this issue pointed to the problem: we were building up a dynamic expression tree and using Expressions.Expression.Constant to provide the parameter to a where clause. Using a constant expression means that Entity Framework Core doesn't parameterize the SQL query and was a change in behavior from Entity Framework 6.
We were using this expression tree everywhere that we were getting something by its ID, which is why it was such a big problem.
So, this is what we changed:
// Before
var param = Expressions.Expression.Parameter(typeof(T));

Expression = Expressions.Expression.Lambda<Func<T, bool>>(
  Expressions.Expression.Call(
    Expressions.Expression.Constant(valuesToFilter),
    "Contains",
    Type.EmptyTypes,
    Expressions.Expression.Property(param, propertyName)),
  param);


// After
var param = Expressions.Expression.Parameter(typeof(T));

// This is what we added
Expression<Func<List<int>>> valuesToFilterLambda = () => valuesToFilter;

Expression = Expressions.Expression.Lambda<Func<T, bool>>(
  Expressions.Expression.Call(
    valuesToFilterLambda.Body,
    "Contains",
    Type.EmptyTypes,
    Expressions.Expression.Property(param, propertyName)),
  param);
Using a lambda expression to get the expression body causes Entity Framework Core to parameterize the SQL query and therefore just cache one instance of it.
This is the memory usage for the period including the release of the fix. The release is marked in red, and you can see that the difference is dramatic. The steady climb up to over 1GB followed by a crash has been replaced by steady memory usage never exceeding 200MB.

The actual fix isn't something that was on our radar when we first started investigating, but by examining the memory dump and following the evidence we got there eventually.
The lessons to take away from this investigation are:
Memory dumps don't lie — if you have a memory leak, look at the evidence before you.
The fact that Microsoft is developing EF Core in the open, with all issues there for everyone to see, is fantastic.
Simple code changes (in this case one line) can have dramatic effects.
Related Articles
Opinions expressed by DZone contributors are their own.

Comments