How We Load Tested the New BlazeMeter JMX Converter
Learn how BlazeMeter load tested their new JMX Converter, which lets more people test with JMeter and BlazeMeter.
Join the DZone community and get the full member experience.
Join For FreeBlazeMeter Labs released a new version of its JMX Converter at the beginning of October 2018. With the JMX converter, users can convert files from several formats to a JMX file. Then, they can run their tests in Apache JMeter™ and BlazeMeter. This immensely expands the audience that can run load tests and performance tests in these tools.
The JMX Converter supports the following input formats:
- HAR JSON - from Mozilla Firefox traffic
- XML from Internet Explorer
- Selenium Builder input
- PCAP input
- JSON from the BlazeMeter Chrome Extension, HAR and Selenium Builder
Just upload your file. Click "Convert", and get your JMX file.
.png)
.png)
While we were upgrading and creating this product, we used BlazeMeter to test it. We ran both functional tests and performance tests. Here's how:
This step includes manual testing and functional testing. We tested the new UI (our designer Hai Ohayon created a new fantastic and modern design for this project), ran regression tests for different files types, performed integration testing on the BlazeMeter Chrome Extension, etc.
The purpose of performance testing was to find out if our system was stable, and for what number of concurrent users.
1. We created a stress test in JMeter to get an estimation limit of the number of virtual users the Converter can process simultaneously. We used the Concurrency Thread group with the following parameters:
.png)
2. We also included Transactions per Second, Composite Timeline Graph and Active Threads Over Time graphs. These graphs let us correlate the system's stability for transactions per second and the number of users.
3. After running the stress test for 5 minutes, we can already analyze our graphs. On the Transactions per Second graph, we can see that after 2:30 we reached the limit of transactions per second (120 concurrent users):
.png)
4. On the Composite Graph we see the same picture: after 2:30, the limit of successful transactions is reached and other transactions are failed:
.png)
5. Then, we looked at the Active Threads Over Time graph to get the count of parallel users that sent requests at 2:30.
.png)
From this graph, we see that this count was ~50-60 users.
6. Now, we can start a long endurance test for 10 hours in BlazeMeter. We started this test with 40 users (slightly less than the limit) and after 8 hours our server died:
.png)
7. We tried restarting the test, but after a few minutes, we understood the server wasn't working correctly.
.png)
8. What changed after this test: we redesigned the architecture of the web service and also found a logging bug.
9. The next test executions helped detect memory leaks in the new logging: head dumps have a lot of Logger instance after a few hours of endurance testing.
.png)
10. The memory leak was caused because standard Java logging stores all loggers with their logs. This information is unnecessary and causes stress on the system.
When we fixed this, the logger count was no more than 300 (after 11.5k):
.png)
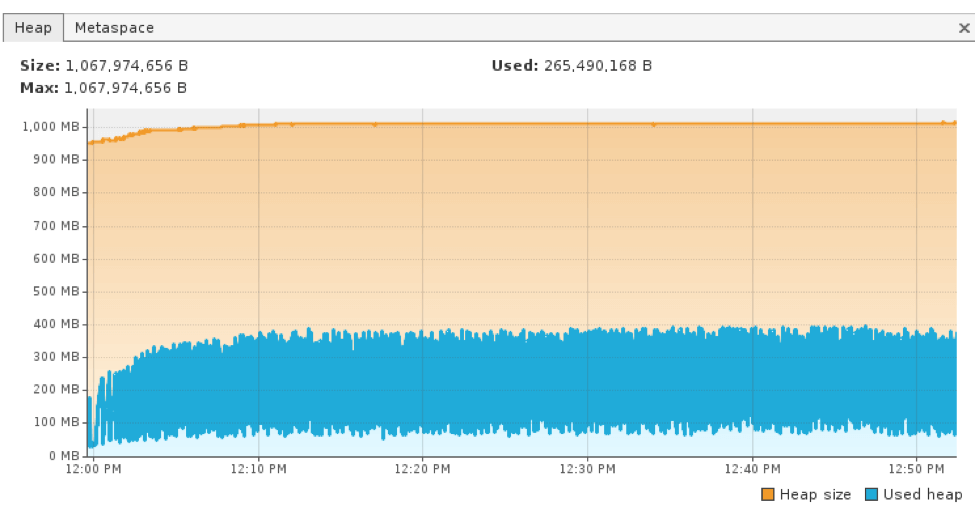
11. The last endurance test passed successfully. The Converter server had a small errors percentage and after 12 hours of load work with 35 virtual users, it still works and saved all the heap memory.
.png)

By running our test through BlazeMeter, we were able to run a 10-hour test without crashing our server, In addition, we were able to store reports and logs for weeks, open them up after three weeks and compare these release stats with future release stats.
Published at DZone with permission of Artem Fedorov, DZone MVB. See the original article here.
Opinions expressed by DZone contributors are their own.

Comments