How To Use SQL To Analyze and Visualize Data
Discover using SQL for data analysis and visualization. Master queries for insights, enhance decision-making with visualizations.
Join the DZone community and get the full member experience.
Join For FreeIn today's data-driven world, the ability to analyze and visualize data is crucial for making informed decisions. SQL (Structured Query Language) is a powerful tool that not only helps you retrieve and manipulate data but also allows you to create compelling visualizations. In this guide, we'll walk you through the steps to effectively use SQL for data analysis and visualization.
In this comprehensive guide, we will delve into the art and science of employing SQL to analyze and visualize data. We'll navigate through the intricacies of data extraction, explore transformative techniques, harness the analytical prowess of SQL, and ultimately unveil the captivating world of data visualization. The primary focus will remain on the core question: "How to visualize data?" This journey will equip you with the skills to extract actionable insights from raw data and present them in a visually compelling manner.
As we embark on this exploration, we'll uncover the pivotal steps that constitute the process. From querying databases to shaping data into meaningful formats, conducting intricate analyses, to selecting the right visualization tools, each phase contributes to unraveling the story hidden within the data. Moreover, we'll delve into the realm of ethical considerations, iterative refinement, and the art of crafting narratives around data-driven insights.
The path to mastering the synergy of SQL, data analysis, and visualization is dynamic and ever-evolving. It requires both technical acumen and creative finesse. By the time you reach the end of this guide, you'll be well-equipped to not only wield SQL for deciphering complex datasets but also to present your discoveries in a manner that resonates with diverse audiences.
What Is Data Analysis?
Data analysis involves the systematic process of refining, converting, and manipulating raw data to derive meaningful and pertinent insights. These insights serve as a foundation for well-informed business decisions, with the resultant statistics and information often translated into visually accessible formats like tables, charts, and graphs. The process of using SQL to analyze and visualize data involves several essential steps that guide you from data extraction to insightful visualization:
Data Extraction
Start by extracting the relevant data from your database using SQL queries. Use SELECT statements to retrieve the necessary columns and rows that you want to analyze. You can apply filters, aggregate functions, and sorting to refine your data extraction process.
Data Transformation
Once you have your data, it's time to transform it into a format suitable for analysis and visualization. SQL offers various functions for data transformation, such as CASE statements for creating calculated columns, JOINs for combining tables, and GROUP BY for aggregating data.
Data Analysis

Perform insightful data analysis using SQL's capabilities. Utilize functions like COUNT, SUM, AVG, and more to derive meaningful metrics from your data. Leverage subqueries to dig deeper into your data and answer specific questions.
Data Visualization
Now comes the exciting part — visualizing your analyzed data. SQL might not directly generate visualizations, but it can provide the data needed for visualization tools like Tableau, Power BI, or Python libraries like Matplotlib and Seaborn. Export your transformed data into a format compatible with these tools.
Choosing the Right Visualization
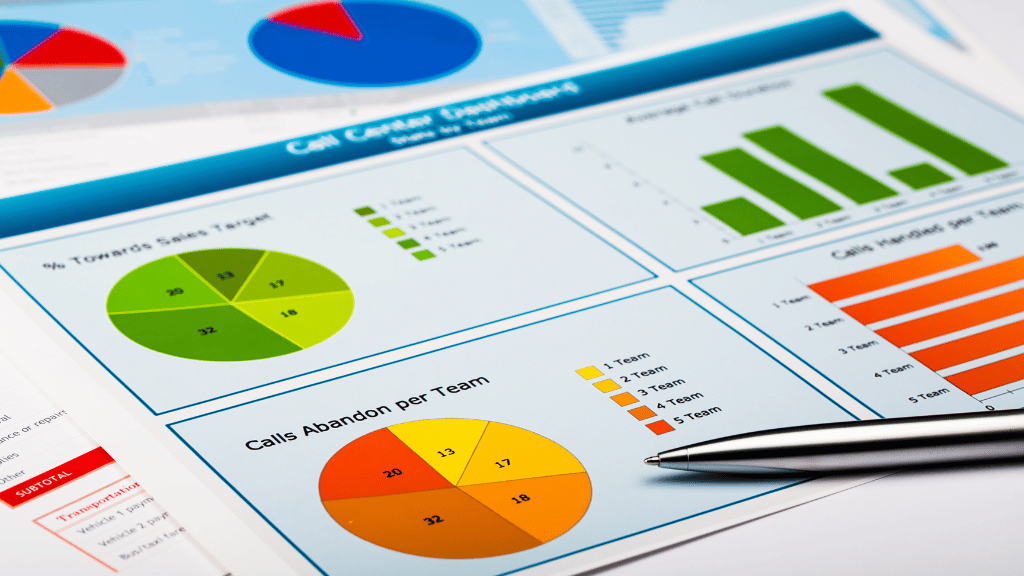
Select the appropriate visualization type based on the nature of your data and the insights you want to convey. Bar charts, line graphs, pie charts, scatter plots, and heat maps are just a few examples. The primary keyword, "how to visualize data," becomes essential here as you explore techniques for making your data come to life visually.
Creating Visualizations
In your chosen visualization tool, import the data and start creating visualizations. Customize colors, labels, and titles to enhance the clarity and aesthetics of your charts. Remember that the goal is to present complex data in a clear and understandable manner.
Adding Insights
Accompany your visualizations with meaningful insights. Interpret the trends, patterns, and anomalies that you've identified through your SQL analysis. Clearly explain the implications of the data for your audience.
Interactive Visualizations
Consider creating interactive visualizations that allow users to explore the data on their terms. Many visualization tools support interactivity, enabling users to zoom in, filter, and drill down into specific data points.
Regular Updates
Data analysis is an ongoing process. Schedule regular updates to your visualizations as new data becomes available. Automation can help ensure that your visualizations stay current and relevant.
By following these steps, you can effectively leverage SQL to analyze and visualize data, unlocking valuable insights and driving data-informed actions
Conclusion
Using SQL to analyze and visualize data is a powerful combination that empowers you to extract insights and communicate them effectively. By following these steps, you can harness the potential of SQL to transform raw data into compelling visualizations that drive informed decision-making.
Furthermore, the ability to communicate complex information effectively is paramount in a world saturated with data. SQL, when coupled with adept visualization techniques, bridges the gap between raw numbers and insightful stories. Your data takes on a life of its own, allowing stakeholders to comprehend intricate concepts swiftly and aiding them in making well-informed decisions.
In a world replete with data, your proficiency in using SQL to analyze and visualize data becomes a hallmark of leadership and progress. By mastering these intricacies and weaving them into your professional fabric, you wield the full potential of SQL as a transformative force, reshaping the way we perceive, comprehend, and act upon the data that surrounds us.
Opinions expressed by DZone contributors are their own.

Comments