How To Send SQL Server CPU Utilization Alerts Using SQL Server Agent
This article explains how to send an email alert using SQL Server alerts when the SQL Server CPU utilization reaches a specific threshold.
Join the DZone community and get the full member experience.
Join For FreeIn Microsoft SQL Server, you can use T-SQL and SQL Server Agent to generate an alert when CPU usage exceeds a threshold, such as 80%. Here's an example of how you can achieve this:
- Create a SQL Server Agent alert: Open SQL Server Management Studio (SSMS) and connect to your SQL Server instance. Navigate to the SQL Server Agent node in the Object Explorer, right-click on the "Alerts" folder, and select "New Alert."
- Configure the alert properties: In the "New Alert" dialog, configure the following properties:
- Name: Provide a name for the alert.
- Type: Select the type of alert as "SQL Server performance condition alert."
- Object: Choose the "Resource Pool Stats."
- Counter: Choose the "CPU Usage target %" counter.
- Instance: Select "default" to monitor the overall CPU usage of the entire system.
- Alert if counter: Choose "Rises above" to trigger the alert when CPU usage exceeds the threshold.
- Value: Enter "0.8" to set the threshold for CPU usage to 80%.
- Enable this alert: Check this option to enable the alert.
- Response: Choose the appropriate response action, such as "Notify operators" or "Execute job" to determine what action should be taken when the alert is triggered.
- Additional actions: As needed, you can configure additional actions, such as sending an email or running a script.
- Click on "OK" to create the alert.
Once the alert is created, SQL Server Agent will automatically monitor the CPU usage based on the specified threshold. When the CPU usage exceeds 80%, the alert will be triggered, and the configured response action will be executed, such as sending notifications or running a script.
T-SQL Stored Procedure To Send CPU-Intensive Queries
Let us understand this with a simple demonstration. Suppose I want to create an alert when the CPU utilization reaches 80%; the SQL Server automatically sends the alert along with the list of the top 10 CPU-intensive queries. We will email the queries in an HTML table.
We can use the following query to populate the top 10 CPU-intensive queries list.
SELECT TOP 10 session.session_id,
           req.cpu_time,
           req.logical_reads,
           req.reads,
           req.writes,
           SUBSTRING(sqltext.TEXT, (req.statement_start_offset / 2) + 1,
           ((CASE req.statement_end_offset
                WHEN -1 THEN DATALENGTH(sqltext.TEXT)
                ELSE req.statement_end_offset
            END - req.statement_start_offset) / 2) + 1) AS statement_text,
           COALESCE(QUOTENAME(DB_NAME(sqltext.dbid)) + N'.' + QUOTENAME(OBJECT_SCHEMA_NAME(sqltext.objectid, sqltext.dbid))
           + N'.' + QUOTENAME(OBJECT_NAME(sqltext.objectid, sqltext.dbid)), '') AS command_text,
  	     req.command,
           session.login_name,
           session.host_name,
           session.program_name,
           session.last_request_end_time,
           session.login_time
FROM sys.dm_exec_sessions AS session
JOIN sys.dm_exec_requests AS req ON req.session_id = session.session_id CROSS APPLY sys.Dm_exec_sql_text(req.sql_handle) AS sqltext
WHERE req.session_id != @@SPID
ORDER BY req.cpu_time DESC
Query Output

The second step is storing query output in a temporary table. The table definition and INSERT query are following:
create table #tbl_HighCPU_Query_Output
(
sessionID int,
cpu_time bigint,
logicalReads bigint,
Reads Bigint,
writes bigint, QueryStatement varchar(max), command_text varchar(max), command varchar(1500),
login_name varchar(1000),
hostname varchar(50),
program_name varchar(500),
last_request_end_time datetime,
login_time datetime
)
INSERT INTO #tbl_HighCPU_Query_Output
SELECT TOP 10 session.session_id,
           req.cpu_time,
           req.logical_reads,
           req.reads,
           req.writes,
           SUBSTRING(sqltext.TEXT, (req.statement_start_offset / 2) + 1,
           ((CASE req.statement_end_offset
                WHEN -1 THEN DATALENGTH(sqltext.TEXT)
                ELSE req.statement_end_offset
            END - req.statement_start_offset) / 2) + 1) AS statement_text,
           COALESCE(QUOTENAME(DB_NAME(sqltext.dbid)) + N'.' + QUOTENAME(OBJECT_SCHEMA_NAME(sqltext.objectid, sqltext.dbid))
           + N'.' + QUOTENAME(OBJECT_NAME(sqltext.objectid, sqltext.dbid)), '') AS command_text,
           req.command,
           session.login_name,
           session.host_name,
           session.program_name,
           session.last_request_end_time,
           session.login_time
FROM sys.dm_exec_sessions AS session
JOIN sys.dm_exec_requests AS req ON req.session_id = session.session_id CROSS APPLY sys.Dm_exec_sql_text(req.sql_handle) AS sqltext
WHERE req.session_id != @@SPID
ORDER BY req.cpu_time DESC
The third step is to create a dynamic query with HTML tags to display the query output in tabular format. The script is below:
DECLARE @HTMLString nvarchar(max)
SET @HTMLString=
'
<H2>Top 10 CPU Intesnive Queries</H2>
<table id="AutoNumber1" borderColor="#111111" border="1">
   <tr>
  <td bgcolor="#99CC33">session ID</td>
  <td bgColor="#99CC33">CPU Time</td>
  <td bgcolor="#99CC33">Logical Reads<</b></td>
  <td bgcolor="#99CC33">Reads</td>
  <td bgcolor="#99CC33">Writes</td>
  <td bgcolor="#99CC33">Stored Procedure</td>
  <td bgcolor="#99CC33">Command</td>
  <td bgcolor="#99CC33">Login name</td>
  <td bgcolor="#99CC33">hostname</td>
  <td bgColor="#99CC33">program_name</td>
  <td bgcolor="#99CC33">last_request_end_time</b></td>
  <td bgcolor="#99CC33">login_time</td>
   </tr>'
+CAST((SELECT distinct
  td =  sessionID ,' ' ,
 td= cpu_time ,' ' ,
 td = logicalReads,' ' ,
 td = Reads,' ' ,
 td = writes,' ',
 td = DBObject,' ' ,
 td = command,' ' ,
 td = login_name,' ' ,
 td =  hostname ,' ' ,
 td= program_name ,' ' ,
 td = last_request_end_time,' ' ,
 td = login_time,' '

FROM
 #tbl_HighCPU_Query_Output WHERE program_name not like '%Mail%'

 FOR XML PATH('tr'), TYPE) AS NVARCHAR(MAX))+'</table>'
The fourth step is to configure database mail to send the alert. You can read this article to learn how to configure the database mail in SQL Server. The entire stored procedure is following:
USE dbatools

 go

 ALTER PROCEDURE Sp_send_highcpu_alert
 AS
   BEGIN
       CREATE TABLE #tbl_highcpu_query_output
         (
            sessionid             INT,
            cpu_time              BIGINT,
            logicalreads          BIGINT,
            reads                 BIGINT,
            writes                BIGINT,
            querystatement        VARCHAR(max),
            command_text          VARCHAR(max),
            command               VARCHAR(1500),
            login_name            VARCHAR(1000),
            hostname              VARCHAR(50),
            program_name          VARCHAR(500),
            last_request_end_time DATETIME,
            login_time            DATETIME
         )

       INSERT INTO #tbl_highcpu_query_output
       SELECT TOP 10 session.session_id,
                     req.cpu_time,
                     req.logical_reads,
                     req.reads,
                     req.writes,
                     Substring(sqltext.text, ( req.statement_start_offset / 2 ) +
                                             1
                     , (
                     (
                     CASE req.statement_end_offset
                       WHEN -1 THEN Datalength(sqltext.text)
                       ELSE req.statement_end_offset
                     END - req.statement_start_offset ) / 2 ) + 1)
                     AS statement_text,
                     COALESCE(Quotename(Db_name(sqltext.dbid)) + N'.'
                              + Quotename(Object_schema_name(sqltext.objectid,
                              sqltext.dbid))
                              + N'.'
                              + Quotename(Object_name(sqltext.objectid,
                              sqltext.dbid)),
                     '') AS
                     command_text,
                     req.command,
                     session.login_name,
                     session.host_name,
                     session.program_name,
                     session.last_request_end_time,
                     session.login_time
       FROM   sys.dm_exec_sessions AS session
              JOIN sys.dm_exec_requests AS req
                ON req.session_id = session.session_id
              CROSS apply sys.Dm_exec_sql_text(req.sql_handle) AS sqltext
       WHERE  req.session_id != @@SPID
       ORDER  BY req.cpu_time DESC

       DECLARE @HTMLString NVARCHAR(max)
       DECLARE @SUBJECT VARCHAR(max) = 'High CPU Alert on: ' + @@servername + '.'

       SET @HTMLString= '   <H2>Top 10 CPU Intesnive Queries</H2>   <table id="AutoNumber1" borderColor="#111111" border="1">      <tr>     <td bgcolor="#99CC33">session ID</td>     <td bgColor="#99CC33">CPU Time</td>     <td bgcolor="#99CC33">Logical Reads<</b></td>     <td bgcolor="#99CC33">Reads</td>     <td bgcolor="#99CC33">Writes</td>     <td bgcolor="#99CC33">Query Statement</td>     <td bgcolor="#99CC33">Stored Procedure</td>     <td bgcolor="#99CC33">Command</td>     <td bgcolor="#99CC33">Login name</td>     <td bgcolor="#99CC33">hostname</td>     <td bgColor="#99CC33">program_name</td>     <td bgcolor="#99CC33">last_request_end_time</b></td>     <td bgcolor="#99CC33">login_time</td>      </tr>'
                        + Cast((SELECT DISTINCT td = sessionid, ' ', td= cpu_time
                        ,
                        ' ',
                        td = logicalreads, ' ', td = reads, ' ', td = writes, ' '
                        ,
                        td =
                        querystatement, ' ', td = command_text, ' ', td = command
                        ,
                        ' ',
                        td = login_name, ' ', td = hostname, ' ', td=
                        program_name,
                        ' '
                        , td = last_request_end_time, ' ', td = login_time, ' '
                        FROM
                        #tbl_highcpu_query_output WHERE program_name NOT LIKE
                        '%Mail%'
                        FOR xml path('tr'), type) AS NVARCHAR(max))
                        + '</table>'

       SELECT @HTMLString

       -- Send email using sp_send_dbmail
       EXEC msdb.dbo.Sp_send_dbmail
         @profile_name = 'YourProfile',
         -- Replace with the name of your DbMail profile
         @recipients = 'YourRecipients',
         @subject = @subject,
         @body = @HTMLString,
         @body_format = 'HTML';
   END
Configure Alert
Create a database alert, as I explained at the article's beginning. The alert parameters should be as shown in the screenshot below.

When the alert is raised, we want to send the list of CPU-intensive queries. To do that, we must create an SQL Job. I have created a SQL Server Agent job named Populate_High_CPU_Queries. The SQL Job executes the sp_send_HIGHCPU_Alert stored procedure. You can read this article to learn how to create an SQL Server agent job.
In our case, the job step should look like the following image:

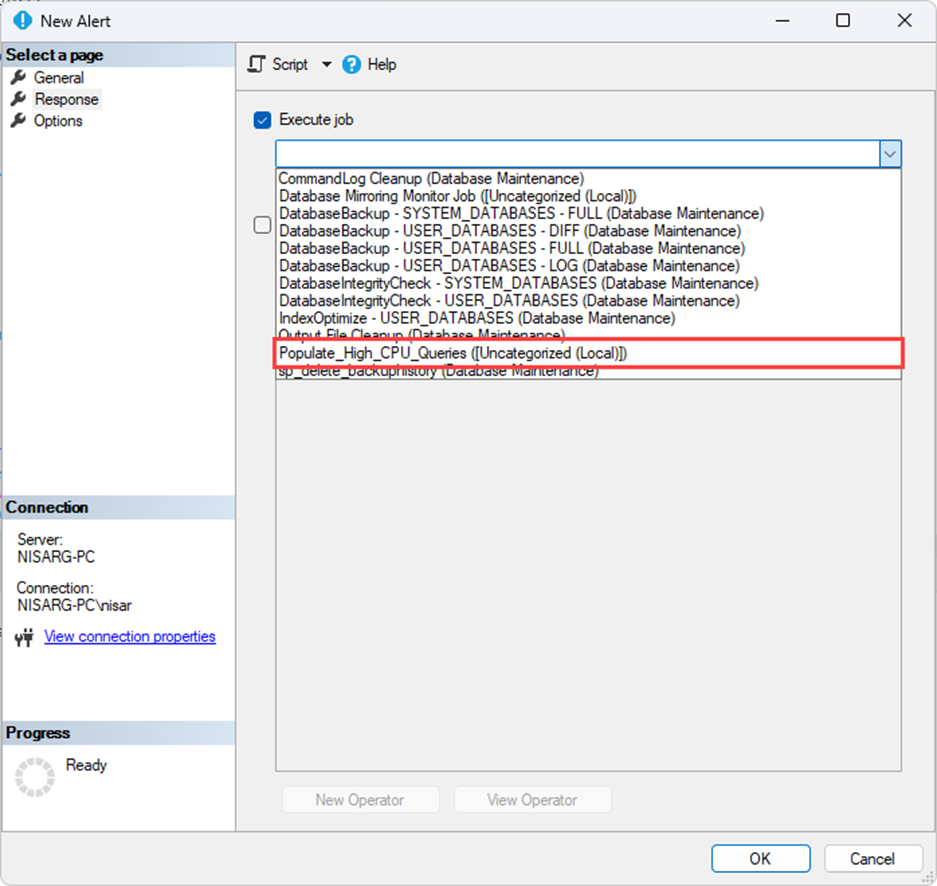
Once the SQL job named Populate_High_CPU_Queries is created, you can specify the job name in the response option of the alert. Below is the image of the Response tab for reference.

Here I am using my demo setup, and I am not able to replicate the 80% instance CPU utilization. Hence, the SQL server will not trigger an alert. But for reference, I have manually executed the stored procedure. The procedure sent a mail with a list of queries which looks like the following image:

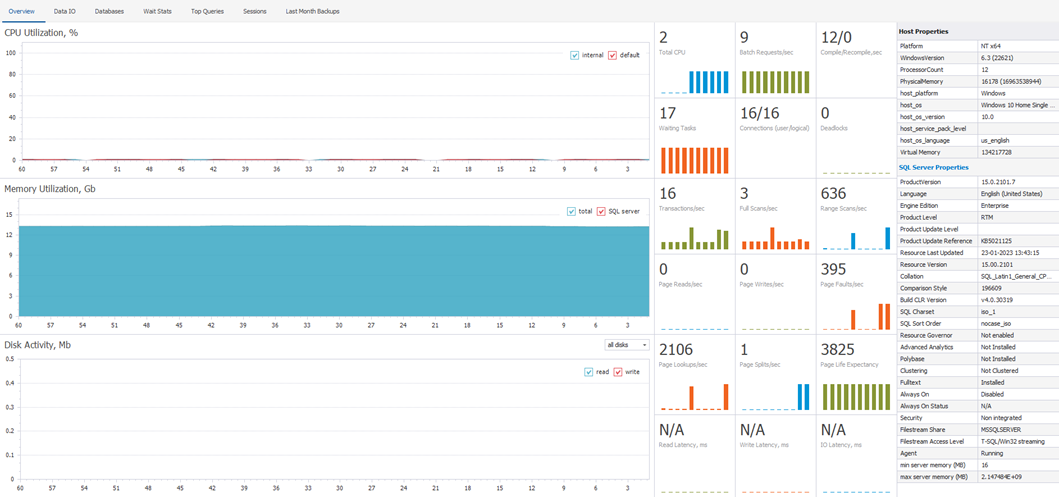
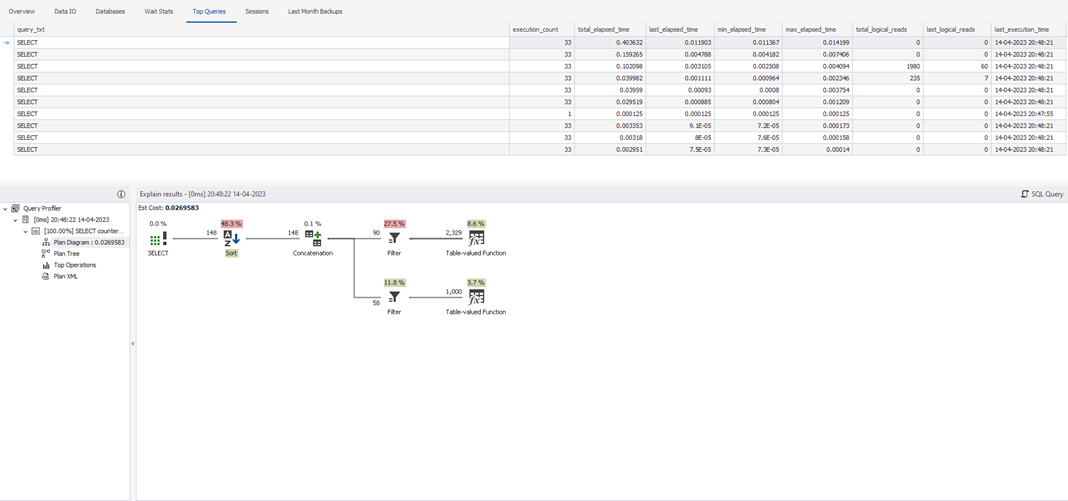
I would like to reference a product named dbForge Studio for SQL Server. dbForge Studio for SQL Server has a feature named SQL Monitor which provides many details and real-time monitoring of the SQL Server resource utilization. This feature is helpful because you can see the status of the entire database server from one central dashboard. Now, when viewing real-time data, you might not use the alerts and keep an eye on CPU utilization %. When you see the spike in CPU, you can directly open the Top Queries tab, which shows the details of resource-intensive queries. The SQL Monitor looks like the following image.

The screenshot of the Top Queries feature:

Summary
In this article, we learned how to create an alert based on CPU utilization using SQL Server Alerts. Also, we learned how to send an HTML-formatted email using the SQL Server database mail feature.
Opinions expressed by DZone contributors are their own.

Comments