How to Install Pixie for Kubernetes Monitoring: The Complete Guide
Pixie is an open-source observability tool for Kubernetes applications that allows software engineers to view the high-level state of Kubernetes clusters.
Join the DZone community and get the full member experience.
Join For FreeSince Pixie's acquisition by New Relic in late 2020, there has been rapid growth in its features, scope, and vision. It does not end there. New Relic has an ambitious long-term roadmap for a Pixie that better supports third-party tools, plugins, and very large Kubernetes clusters. It is important to highlight that most older monitoring systems were considered inefficient due to their operational overhead. Taking this in the context of a cloud environment, where you're paying by the resources used, this can quickly become expensive.
Pixie offers monitoring, telemetry, metrics, and more with less than 5% CPU overhead and latency degradation during data collection. Extended platform usage with considerable workloads will maintain an average of 2% overhead, an excellent improvement over legacy systems.
What Is Pixie?
Pixie is an open-source tool designed to assist software engineers in monitoring as well as analyzing applications and services running inside Kubernetes clusters. It eliminates the need to add instrumentation to the developers' source code manually. It also saves time by providing functional out-of-the-box metrics collection tools, graphs, GUI, and logs, making monitoring simple and eliminating the expensive task of building a system yourself.
How to Install Pixie
When it comes to installing Pixie, you have two options:
Community Cloud
Pixie offers a fully managed community cloud that’s completely free and hosted by New Relic. They employ a data retention policy of 24 hours that can be lifted by integrating your New Relic license to Pixie. Installation on a Kubernetes cluster is simple, since all you have to do is run this command:
bash -c "$(curl -fsSL https://withpixie.ai/install.sh)"
If you still have installation questions, Pixie provides a Community Cloud with all the FAQs addressed: Quick Start Guide.
Self-Managed Cloud
Suppose you’d rather run Pixie on your own infrastructures, such as EKS, GKE, AKS, Minikube, or Self-Managed Kubernetes. The good news is that it is entirely possible. Nonetheless, you will have to run a few manual steps, such as setting up DNS, authentications, and certificates. You can then deploy Pixie in your Kubernetes cluster using a Helm chart, manifest files, or using the CLI.
After installing Pixie CLI, you can deploy it in your Kubernetes cluster with this command:
px deploy --dev_cloud_namespace plc
For more detail on how to self-host, head to the self-managed Pixie guide here.
Note that when deploying Pixie, it will run several Kubernetes services on your cluster to help it obtain information about script execution, data aggregation, data integration, and data backup.
Below you can observe these services running on a cluster:
pl kelvin-6ccf668d69-9gbxw 1/1 Running 0 121mpl nats-operator-6f9b67b59-tl7b4 1/1 Running 0 121mpl pl-nats-1 1/1 Running 0 121mpl vizier-certmgr-5fc7d795f-62rz9 1/1 Running 0 121mpl vizier-cloud-connector-657d4cb6c5-td4wb 1/1 Running 1 121mpl vizier-metadata-0 1/1 Running 0 121mpl vizier-pem-msstz 1/1 Running 0 121mpl vizier-proxy-c64648cfb-txg2c 1/1 Running 0 121mpl vizier-query-broker-7c6d66d577-dtrv4 1/1 Running 0 121m
How to Use Pixie
You can use Pixie in two different ways:
Pixie Live
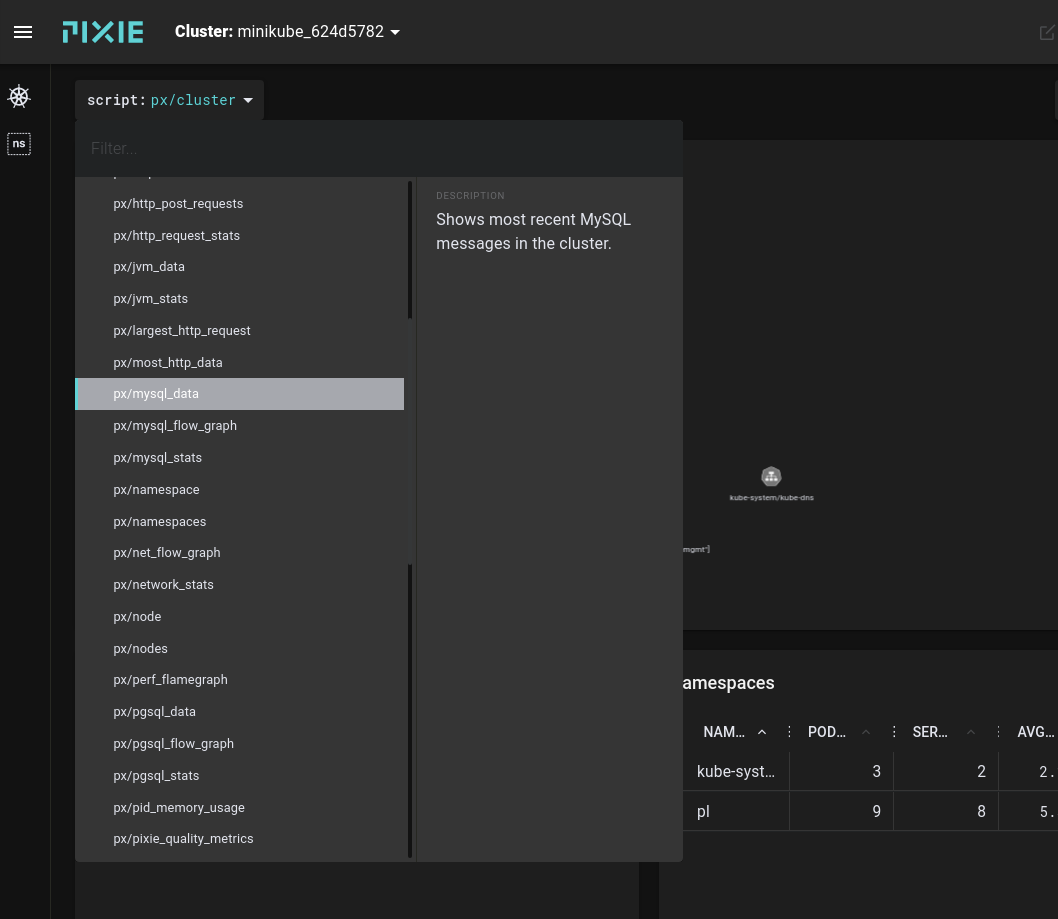
Essentially, Pixie offers a Live Web UI that allows you to:
- Choose your Kubernetes clusters.
- Select a variety of scripts.
- Modify arguments when the script allows for it.
- Get a live representation of the script running.
- Navigate Kubernetes entities using deep links.

Furthermore, due to its open-source nature, Pixie offers a vast repository of community-contributed scripts to cover almost every possible use case right out of the box. Examples include:
- DNS request graphs
- Latency stats for MySQL
- Average memory usage for a pod
Pixie CLI
Pixie CLI is the fastest way to install the solution and an effective way to run existing community scripts, with a simple execution of the command px run script_name.
It can also be used to run the community scripts from the public directory — for example, px run px/dns_data.
The CLI also allows for script output in different formats (JSON and CSV) using the -o argument, which helps the readability of script output using CLI. To output the data to one of those formats, run the command:
px run script_name_ -o csv > dns_tables.csv # used to write the output to a .csv file.px run script_anem -o json | jq # used to output to the json format and send to jq.
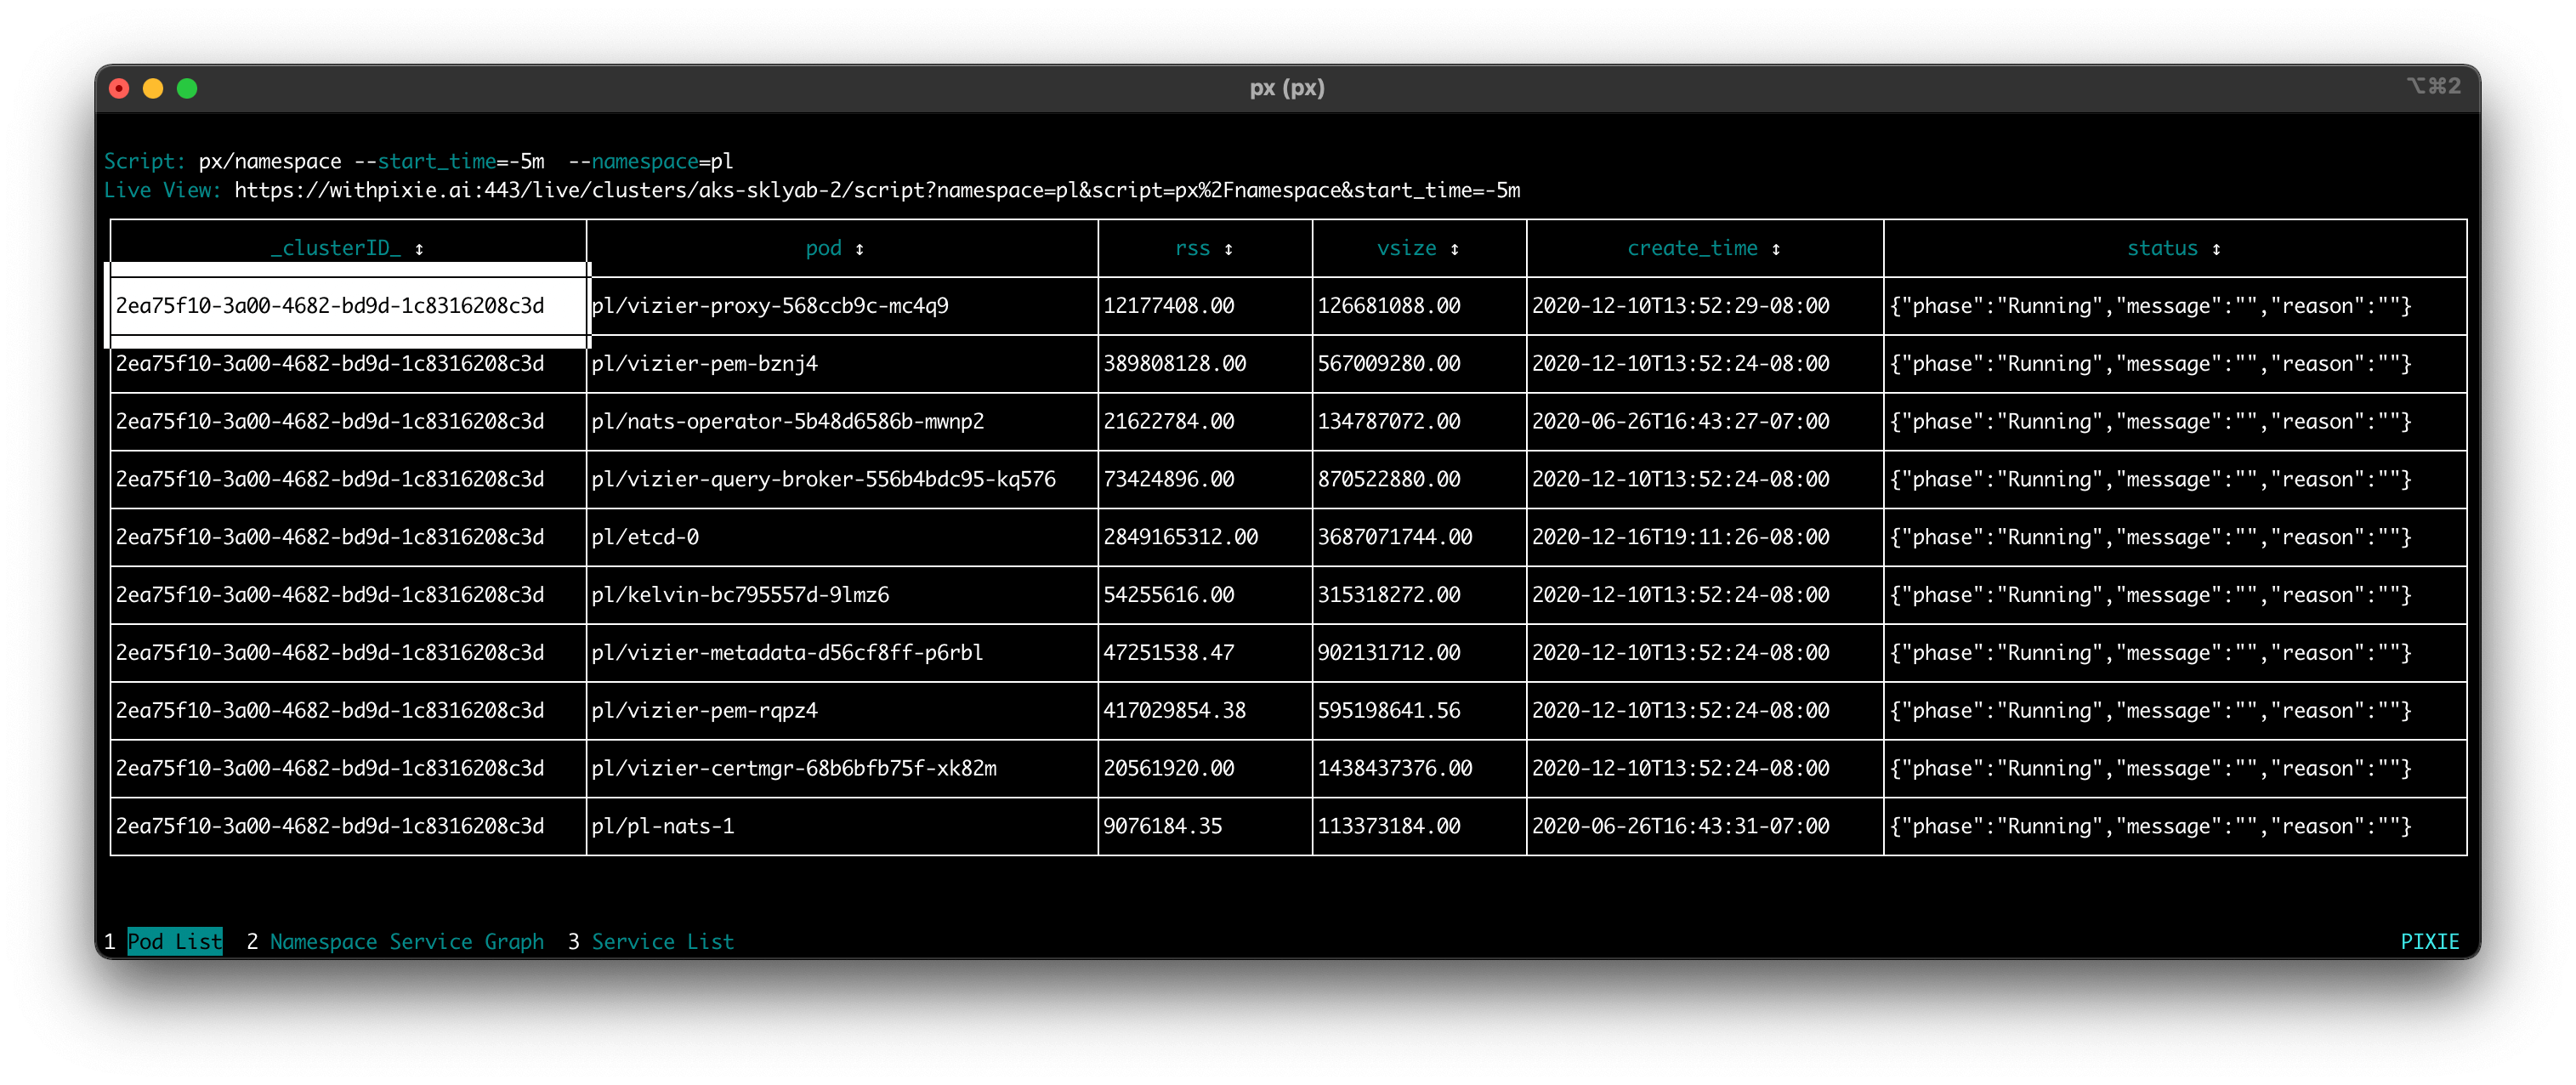
Lastly, the Live CLI outputs interactive output tables, ideal for quick checks of the Pixie services. You can invoke this command by using px live script_name.
You can also sort columns by clicking on them, navigating tables using the arrow keys or mouse, and expanding the truncated cells with ctrl+click.
Bonus Tip: PxL Scripts
Pixie has cultivated a large community of open-source PxL scripts, which cover the vast majority of its users’ needs. They keep a GitHub Repository with all approved community scripts here. Additionally, if you can't find a script that suits your needs, they provide a step-by-step guide (still in construction) on how to write your own PxL scripts.
If you want to contribute your scripts to the community, fill an issue on their GitHub page and explain which use case you intend to cover. Then, create a pull request with a branch of your fork, commit your script folder by pushing it to their Git, and make a pull request with the original issue tag. If accepted, you'll be able to find your script in the px/ community directory.

Pixie Use Cases
Pixie can cover a great variety of use cases, such as:
- DB Query Profiling: Monitoring DB queries' health and usage, checking which services are talking to the database, and checking if they're making redundant queries or slowing down other services.
- Infrastructure Health: Checking node health, memory leaks, node overload, in-depth node data, and information to optimize costs.
- Request Tracing: Providing detailed raw information from service usage and assisting the analysis and optimization of infrastructural performance.
- Service Health: Save on site reliability engineering (SRE) with the efficient, high-visibility health dashboard. At the same time, they provide easily accessible info about the status of every running service being monitored by Pixie.
The Future of Pixie
Pixie has several changes planned for the next couple of years, aiming to reduce manual work, simplify development problems, and strengthen the community. Here's a brief list of what Pixie has in store for the future:
- Improve the already excellent default data visibility by covering full traces, logs, and supporting custom metrics.
- Support for other Kubernetes resources, such as events. Pixie already displays metrics and information of Kubernetes namespace, pods, and services.
- Support larger Kubernetes clusters by optimizing performance and hardening core infrastructure.
- Investment in their application of edge machine learning and artificial intelligence to improve the detection of anomalous data, refinement of interesting data, data compression, and more.
- Data usage in the OpenTelemetry format to use Pixie data to feed third-party applications such as Prometheus and Jaeger while also allowing third-party data to be explored with Pixie.
- A new Pixie API to enable integration with external plugins.
Conclusion
One of the core advantages of using Pixie for your Kubernetes monitoring is that it gives you instant observability of your clusters. You get valuable insights in real time whether you are tracking infrastructure and service health or profiling DB queries. As is evident from the planned improvements, Pixie is only going to only get better in terms of the developer experience when using it to monitor project performance and health.
Published at DZone with permission of Florian Pialoux. See the original article here.
Opinions expressed by DZone contributors are their own.

Comments