Increase Throughput by Eliminating Blocking Code in Your Java REST App
Blocking code is every bit a hinderance to your thoroughput as it sounds. See how you can get rid of it here.
Join the DZone community and get the full member experience.
Join For FreeBlocking code is code which blocks executing threads until their operations finish. It's not always bad to block a thread and wait until the result is ready but there are situations where it's not optimal from a throughput and memory point of view. This article assumes some basic knowledge about the differences between blocking and non-blocking code.
What I am going to do is to introduce a very simple app with some blocking code inside and show you how you can easily figure out where your threads are usually blocked and then you might identify a better way to implement those certain parts of code and do it much more efficiently.
What is AsyncProfiler and How Does It Work?
AsyncProfiler is a very powerful tool for profiling applications. Usually, there are two types of profilers, based on either instrumentation or sampling. If you want to know more and go deeper into this topic, I could definitely recommend links to GitHub or this blog.
In this example, we are going to focus on AsyncProfiler, which is a sampling profiler based on collecting stack traces even outside safepoints. We can get information about CPU, allocation, time spent on execution methods, locks, and actions traceable using perf-tool. More examples available here.
First, follow these instructions from GitHub to download async-profiler.
Let's proceed with our example and demonstrate how to use AsyncProfiler to find blocking code in your application.
Let's Introduce A Nasty Blocking Application
Our highly-distributed application is divided into two parts — an application with an HTTP endpoint accepting string value and a backend application that listens on RabbitMQ queue and transforms a provided string into a new uppercased version and returns it back to the first application. Check out the source code.
Run docker-compose to start one RabbitMQ node:
$ docker-compose upBuild the applications and run the backend service:
$ mvn clean package
$ docker run -d -m=500m --cpus="1" --network host rabbitmq-service
Start the application for handling HTTP requests and storing the provided strings into the queue. Notice that I used some diagnostic options which makes our sampling much more accurate. Without these options we could run into some problems when JIT compiler starts optimizing our code with inlining.
java -XX:+UnlockDiagnosticVMOptions -XX:+DebugNonSafepoints -jar blocking-server-spring/target/blocking-server-spring.jarNow we have to find the PID (Process ID) of our HTTP application to be able to connect it with async-profiler.
profiler.sh -d <time in sec> -o svg=<mode> -e lock -f ~/blocking.svg <pid>There are two options/modes to observe in case of locks.
samples: a number of stack traces retrieved during the time period when the thread was blocked on a particular lock/monitor.
total: tje number of nanoseconds it took to enter the lock/monitor
Let's run the profiler and collect the information about the number of stack traces during thirty seconds:
profiler.sh -d 30 -o svg=total -e lock -f ~/blocking.svg 13878Now we've already started a collection of stack traces and we just need to put our application under the pressure with another great tool: Gatling.
mvn gatling:test -Dgatling.simulationClass=pbouda.rabbitmq.gatling.GeneratorOutput Results and Interpretation
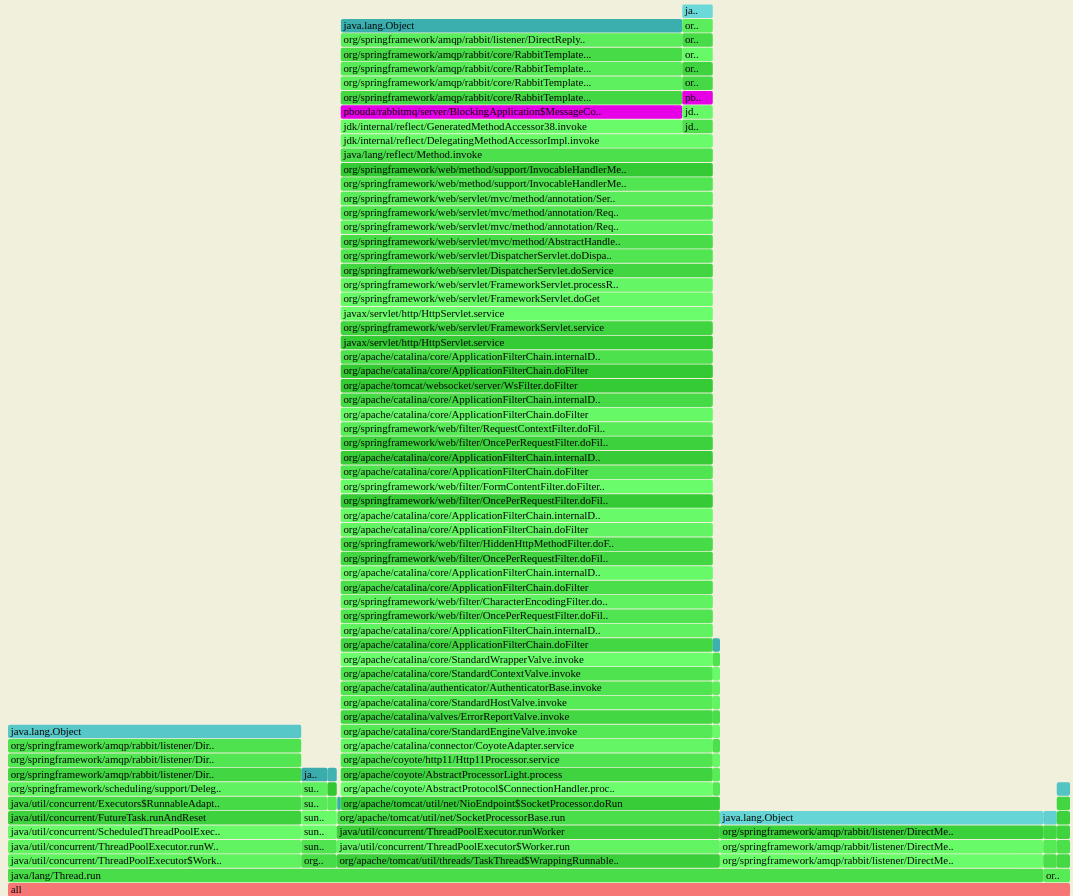
Async-profiler generated an SVG file, which is a flame graph. Our flame graph is actually the set of stack-traces merged according to frames. The leaves of the generated flame graph are the lock/monitor object where the threads were waiting and the number means how many samples hit the given monitor. Of course, the size of the frame reflects the occurrence of the frame in all samples.
We can actually see that a lot of threads were waiting for a response from our backend service to be able to build an HTTP response and send it back to a caller.
The picture tells us to focus to make on a non-blocking the response handling to ensure that our threads don't wait for the response because we can end up with a lot of waiting/blocked threads, which means we keep very expensive objects in our memory doing absolutely nothing. In the worse scenario, we can run out of our thread pool dedicated for handling HTTP requests and block further request processing.
How can we fix it?
A Non-Blocking Version of Our (Still) Nasty Application
We've already identified the biggest problem in our application which can very negatively influence the throughput of our application. Let's find a way to mitigate the problem. The project contains two implementations of the non-blocking version of our application. I'll use Spring implementation (I am not a fan of Spring but want to keep the same framework as in the first example, more precisely the feature called DeferredResult).
What DeferredResult does is that it provides a way to write the response later, even from a different thread. So what we did is we configured an incoming queue (as always in RabbitMQ) and provided a way to write the response from threads waiting for new messages in the queue. Which means we keep regular RabbitMQ consumers and don't block HTTP Server threads. That means we can cache a lot of accepted connections inside of our application and increase the throughput (not latency!) and don't risk that the connection is not accepted or rejected because of lack of HTTP Server threads.
This solution is not a silver bullet; we still need to propagate back pressure to our underlying application and not overwhelm them by request/messages, and we still need to be aware that our connection cannot wait infinitely because of Socket Read Timeout from a client's side.
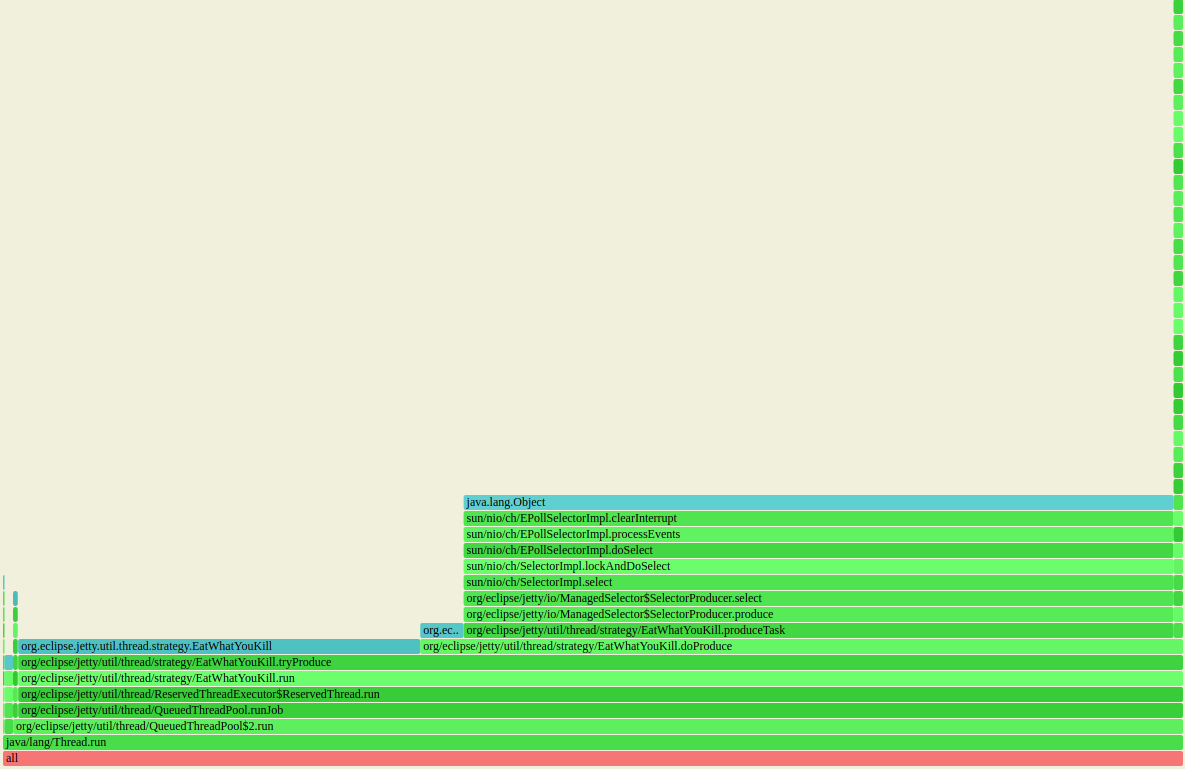
What we can see on the output is that we absolutely eliminated the blocking produced by waiting for responses. The biggest part of our flame graph belongs to waiting for a select and EatWhatYouKill optimization and we discover even very tiny locks in the logback library which wasn't even visible in the previous example.
Summary and What's Next
This way you can eliminate the biggest blockers in your application and tune your application to be able to operate with a smaller number of threads. You can discover other well-known problems such as:
Handling blocking code to the database
However, sometimes getting rid of blocking code is really not needed. There are usually two cases when it's pointless to do it.
First, I run a batch application that uses blocking I/O heavily with a limited number of threads/tasks and for a limited period of time. Just run 20 tasks to retrieve something from the files, block on I/O operations with 20 threads and wait — just do it in parallel.
Second, if I have a limited number of tasks and I really care about the latency — there is nothing better than a blocking operation for latency — just wait until it's ready and then immediately proceed with another computation.
Thank you for reading my article and please leave comments below. If you would like to be notified about new posts, then start following me on Twitter.
Opinions expressed by DZone contributors are their own.


Comments