How to Create a Requirements Traceability Matrix in Excel
In this post, see what a requirements traceability matrix (RTM) is and how you can create one.
Join the DZone community and get the full member experience.
Join For Free
In this post, I’ll explain to you what a requirements traceability matrix (RTM) is and how you can create one. If you are new to requirements traceability, here is a short recap to get you started.
The term traceability is used in a large variety of different contexts, while this article only considers requirements traceability. It is defined as the ability to track each requirement from its origin through the entire development to its validation on each level.

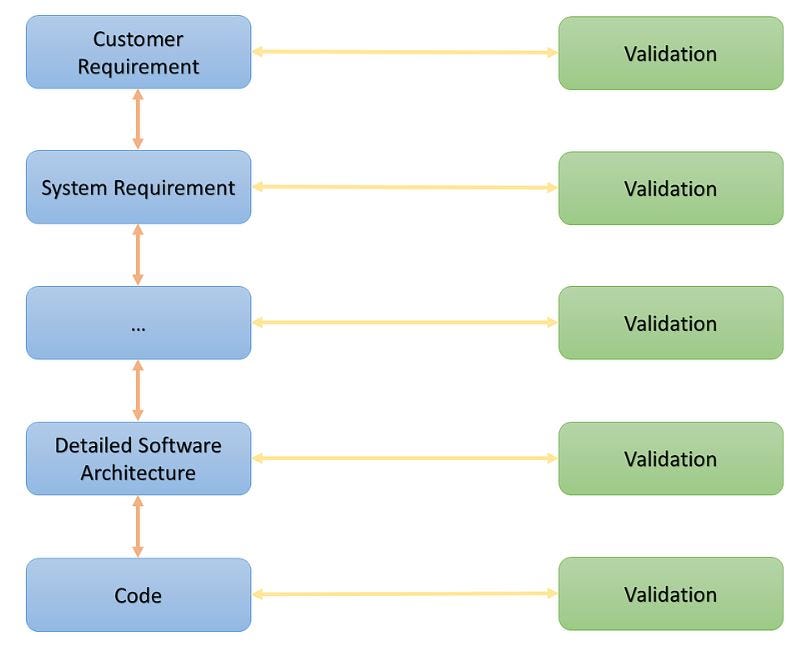
The graphic above shows a very simple representation of a traceability graph on an abstract level. The blue nodes represent different development artifact types. The green nodes are the validations that ensure the quality and proper implementation of the artifact. Direct connections are referred to as links, while link chains are called traces.
The structure and the level of detail that is appropriate for your traceability graph depends on your product and the process you are following. When developing a website for a local tailor, it looks different as if you’re building safety-relevant car parts or medical equipment. However, introducing traceability and using it for analyzing your project, is beneficial in any case.
Traceability can be evaluated in different directions. There is forward traceability (e.g. a requirement to validation) and backward traceability (validation to requirement). Each direction allows to assess different aspects of the project state and will be most beneficial for different roles in the project team. The goal is to establish forward and backward traceability, which is consequently referred to as bidirectional traceability. This is where the traceability matrix comes into play.
What Is a Requirements Traceability Matrix?
A requirements traceability matrix (RTM) is a simple and effective tool that allows to establish and maintain bidirectional traceability for your project.
As the name suggests an RTM is nothing more than a table that displays the relation between different development artifacts. Due to its simplicity, it can be created with the most basic tool — for example with excel. It sometimes even makes sense to draw it on a whiteboard to make it visible to everyone on the team. Depending on the purpose you are creating the RTM for, it can visualize direct links between ‘linked’ artifacts, shows cumulated views on entire ‘traces’.
Please keep in mind that a requirements traceability matrix can be useful for setting up your project traceability in some cases, but you should be aware of its limits.
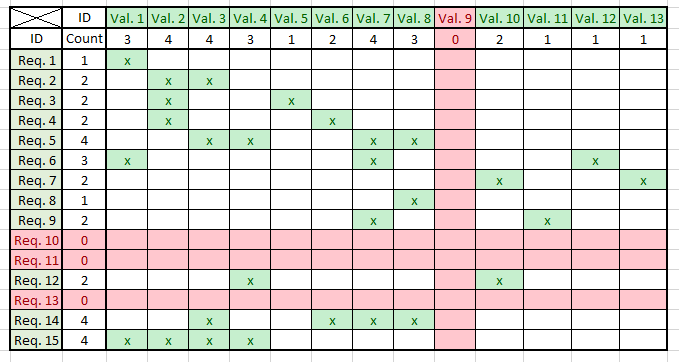
Here is a very simple example of a requirements traceability matrix that represents a cumulated view of an entire trace graph from “Requirement” to “Validation” and can be maintained in any basic spreadsheet tool.

Note that it does not contain the concrete development artifacts, but references them by a unique ID. Although there are good arguments to include more detailed information about the artifacts this would reduce the simplicity and make the information more difficult to access and less easy to comprehend. Traceability is only useful if it’s maintained properly, and it’s only maintained when it’s as simple as possible.
The example represents a compressed representation of the project state. Showing the relations between requirements (Req. 1–15) and validations (Val 1–13), in many to many cardinalities. Whenever a requirement is traceable to a validation it’s marked with an ‘x’.
In the sense of forward traceability, you can see at a glimpse that Req. 10, Req. 11 and Req. 13 are not validated properly. When flipping the reading direction (backward traceability) it is obvious that Val. 9 validates no requirement. At this point, it’s important to understand that the RTM for its own can’t tell you what and why there’s a problem, but it’s extremely efficient in identifying problems and where to look for them.
In a future article we‘ll shed some additional light on how to exploit all the information that’s contained in an RTM, but for now, let’s concentrate on how to establish detailed traceability for an entire project.
How to Create a Traceability Matrix?
There are only three mandatory steps required to establish traceability for your project. If you’re willing to go the extra mile and take the fourth step, you’ll be able to boost your benefits even further. Let’s get started.
Identify Your “Artifact Types”
First of all, you need to find out which types of artifacts are involved in your project. What do you want to keep track of? What’s relevant and useful for your team? What’s required by the customer or other authorities? Make sure each artifact can be identified by a unique ID later.
For this example, we chose 4 artifact types Customer Requirements, Internal Requirements, Implementation and Test Cases.
Other examples of artifact types are:
- requirements (system-, hardware-, legal requirements)
- UI-design-documents (paper prototypes, mock-ups, style guides, mood boards,…)
- software architecture (component diagrams, statecharts, class diagrams)
- implementation (interfaces, protocols)
- tests (unit test, manual tests)
Define the Relations Between Those Artifacts
The next step is to define how the artifacts should be linked to each other. You should only consider direct links. The example contains three link types Customer Requirements to Internal Requirements, Internal Requirements to Implementation and Implementation to Test Case.
Other link examples are:
- customer requirement ←→ system requirement
- software requirement ←→ software architecture
- software detailed design ←→ implementation (code)
- implementation (code) ←→ unit test
When creating your links, make sure that each artifact type can be traced back to a requirement. It often helps to sketch your traceability graph to visualize it. If you end up with artifacts types that are not (at least transitive) connected to a requirement you either missed a link type or it’s arguably not important for your project at all.
Create a Traceability Matrix for Each Link Between Artifact Types
Finally, we need to create one traceability matrix for each link type. List one link participant on one axis, the other one on the other. Use the sketch from the previous step to ensure that you did not miss any links. It is a good idea to include a status field for each artifact, to increase the accuracy of the reflected project state. For example, an artifact may be created but still under development. In the example, we flagged such artifacts as not realized.
After we create the entire set of traceability matrices, we are ready to go and have established bidirectional traceability for our project. To follow a trace in any direction, you have to combine the matrices belonging to that trace just like you would arrange domino stones (see example).
(Optional) Create Additional Metrics That Help to Answer Important Questions Immediately
In addition to the possibility to maintain and evaluate direct links, it is possible to use the RTM to create accumulated view for entire traces. To do so, you simply combine the information from multiple matrices into a single one to make important information more accessible.
In the attached example, you find a combined view, showing the relation from Customer Requirements to Test Case, which immediately reveals that only 47% of the Customer Requirements are covered by a test.
Please feel free to download the example and use it as a template for your project.
Further Reading
Published at DZone with permission of Florian Antony. See the original article here.
Opinions expressed by DZone contributors are their own.

Comments