How Grafana 10 Makes Observability Easier for Developers
Here’s a look at 10 key ways the latest release of Grafana is making it easier for developers to visualize observability data.
Join the DZone community and get the full member experience.
Join For FreeGaining insights into what your app is doing in production is a key requirement for modern dev teams. The days of platform and operations teams doing all the troubleshooting are long gone.
Whether you’re trying to understand user behavior or fix things that broke under load, you need to get to the bottom of things fast. That leads you into the world of logs, traces, and metrics, aka the Holy Trinity of Observability.
With the release of Grafana 10, let’s take a look at some of the key evolutions of this observability platform and how it is making observability an easier discipline for developers.
1. Getting Started Really Fast
In the old days, in order to get those pretty Grafana dashboards, you had to install a time series database, install Grafana, and also instrument your application. Today with Grafana Cloud, developers can access a fully managed observability stack across all the major cloud providers: AWS Marketplace, Microsoft Azure Marketplace, and Google Cloud Marketplace. Grafana Cloud has a “forever free” tier, which includes three users, 10k metrics, 50 GB logs, 50 GB traces, and 500 virtual user hours for k6 load testing.
2. Joining Data from Disparate Datastores
As an open-source project, Grafana’s always been known for its “big tent” philosophy and wants to give developers control of their data. As Grafana 10 ships, Grafana has more than 150 data source plugins that enable you to visualize all sorts of different data across just about every popular database, as well as other monitoring providers. In the company’s 2023 Observability Survey, 38% of respondents said they have 7+ data sources configured in Grafana.
3. New Correlations Feature
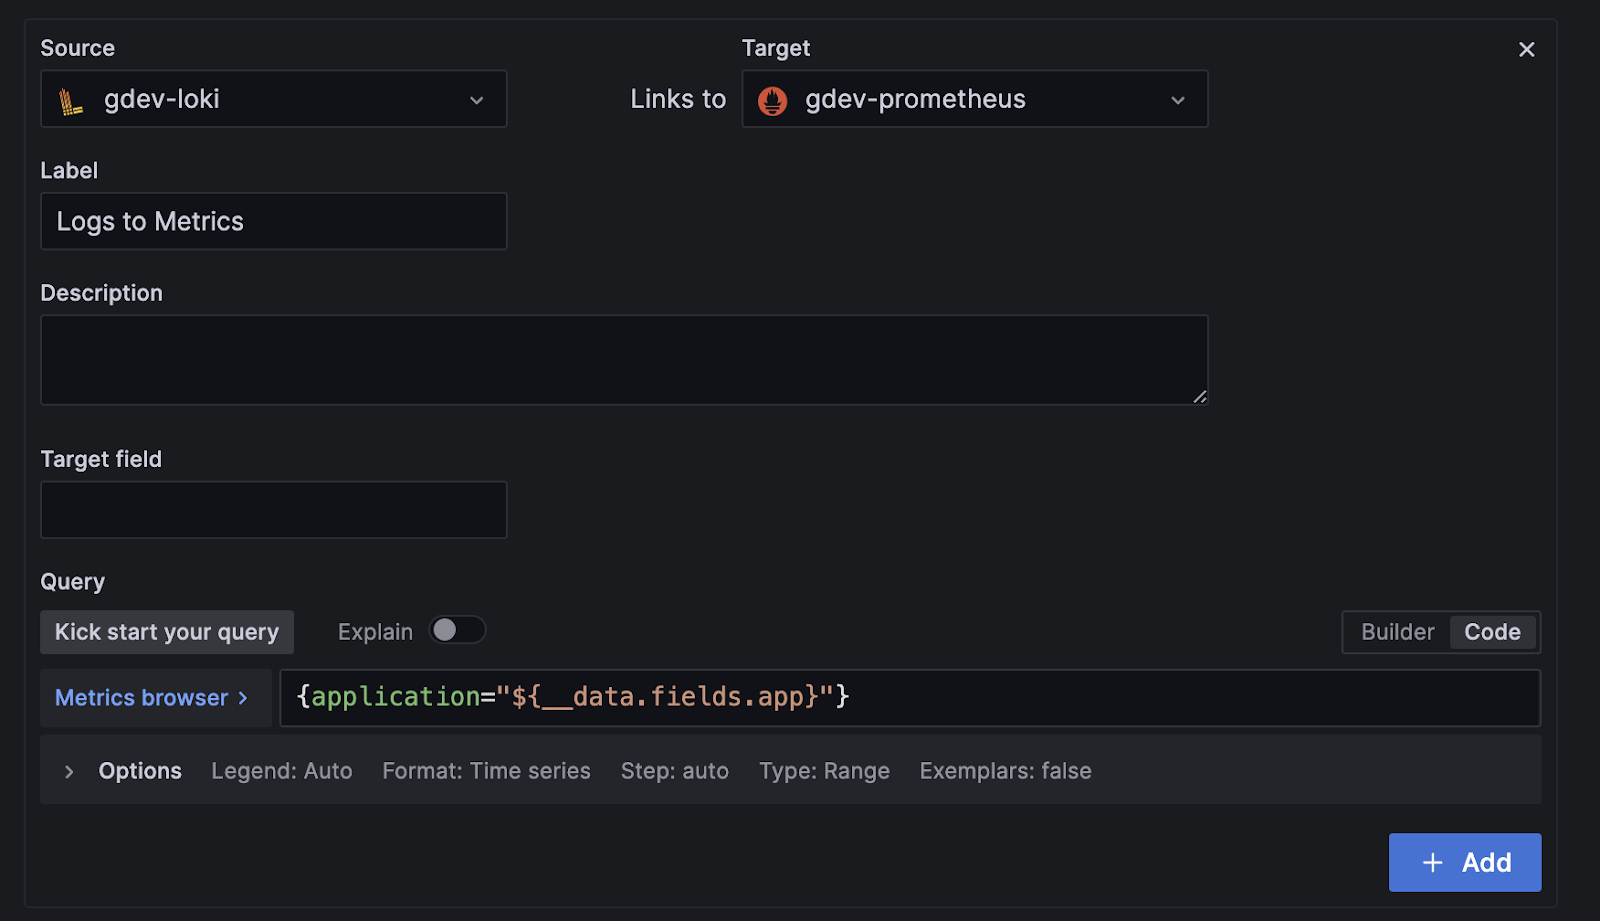
Grafana 10 ships with a new Correlations feature that lets you pivot and link between data sources, making it easier to create a unified view of your entire data landscape and accelerate troubleshooting.

Correlations enable users to connect the dots across multiple data sources.
4. Grafana Scenes
Grafana Scenes is a new frontend library in Grafana 10 that allows you to build dashboard experiences right into your products. Now you can easily create apps that mirror the Grafana dashboarding experience, complete with template variable support, flexible layouts, dynamic panel rendering, and more.
5. Dynamic Dashboards for Real-Time Data
In Grafana 10, Trend Panels allow for graphing ascending numeric X-axis data, while the new datagrid panel offers a spreadsheet-like interface for editing, fine-tuning, and organizing data within each dashboard. There are also new capabilities for collapsing rows, hiding queries, and zooming into panels.

The trend panel allows users to graph ascending numeric X-axis data, enabling more adaptable data visualization.
6. Public Sharing
With the latest updates to Public Dashboards, Grafana dashboards can be added by anyone outside your organization.
7. Grafana as Code
New Grafana as Code features new Go libraries, Graffonet, and an improved Terraform provider.
8. Code Automation
No more grappling with complex JSON or rewriting your code. Grafana 10 introduces a second Grafana interface focused solely on managing dashboards as code.
9. Security and Authentication
Grafana 10 delivers new authentication capabilities, including a self-service SAML UI. This enables you to maintain fine-grained and customized access control.
10. Query Private Data Sources Without Exposing Your Network
New in Grafana 10, a Private Data Source Connect (PDC) overcomes the previous challenges of connecting private data from Grafana Cloud without exposing the network. PDC uses SOCKS over SSH to establish a secure connection between a lightweight PDC agent you deploy on your network and your Grafana Cloud stack. With PDC, you can now query them from Grafana Cloud and maintain secure connections with your private data sources.
Opinions expressed by DZone contributors are their own.

Comments