How to Debug and Deploy Apps With MuleSoft Anypoint Studio
MuleSoft Anypoint Studio's StudioVisual Debugger allows you to run your app in debug mode and stop its execution to check the contents of previous building blocks.
Join the DZone community and get the full member experience.
Join For FreeMuleSoft is incredibly excellent integration platform. MuleSoft Anypoint Studio is very easy and intuitive to use. It is a very lightweight product, as it doesn’t rely on any database. It provides around 120 connectors that you can use to connect to REST and SOAP APIs, SaaS applications, data sources, queues, etc. Anypoint Studio comes with Runtime, which lets you deploy the Mule application and test your app in your machine. It provides step-based debugging to check your application.
Mule provides an online platform to design and publish RAML-based APIs: Anypoint API Manager. API Manager lets you create RAML-based APIs and it provides a facility to publish APIs over a portal publicly or privately. It provides an online Runtime Manager so that you can deploy your application on CloudHub. Deploying the application from Anypoint Studio is very easy.
DataWeave makes transformations very easy. DataWeave is a language used to query and transform complex data. It contains a lot of operators, including filters and functions. It supports various formats including XML, JSON, CSV, Java, and EDI out of the box. DataWeave code looks like JSON syntax and is format-neutral.
APIKit facilitate REST or SOAP API development. You can reference an external RAML or WSDL design, import the design into Studio, or build the RAML or WSDL in Studio using the text editor. The best practice for API design with APIkit is first to design the RAML or WSDL interface outside Studio.
DevKit enables you to develop MuleSoft Anypoint Connectors. A MuleSoft connector is an extension module to the MuleSoft Anypoint Platform, with modules that ease the interconnection of third-party systems and APIs with Mule applications.
Debugging Mule Application With Anypoint Studio
Anypoint Studio comes with StudioVisual Debugger, which allows you to run the application in debug mode and stop its execution to check the contents of previous building blocks.
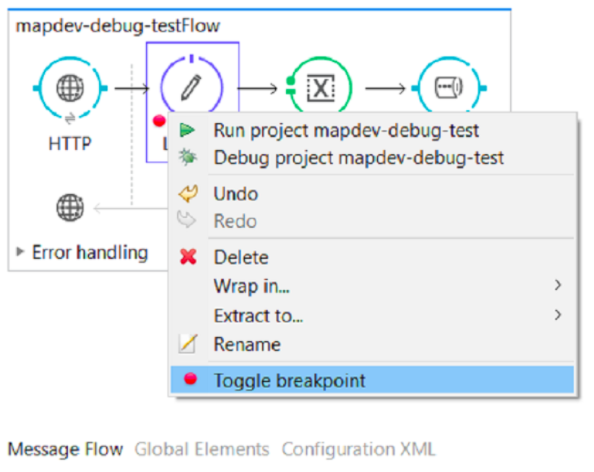
For running the application in debug mode, first, you need to set up a breakpoint on the building block. When the application runs in debug mode, it stops immediately after executing the building block with the breakpoint.
When debugging an application on your local machine, Studio Visual Debugger listens for incoming connections on port 6666and ensure that the firewall is not blocking the port. Set the debug point on building blocks in your application by right-clicking on studio component, as shown below:
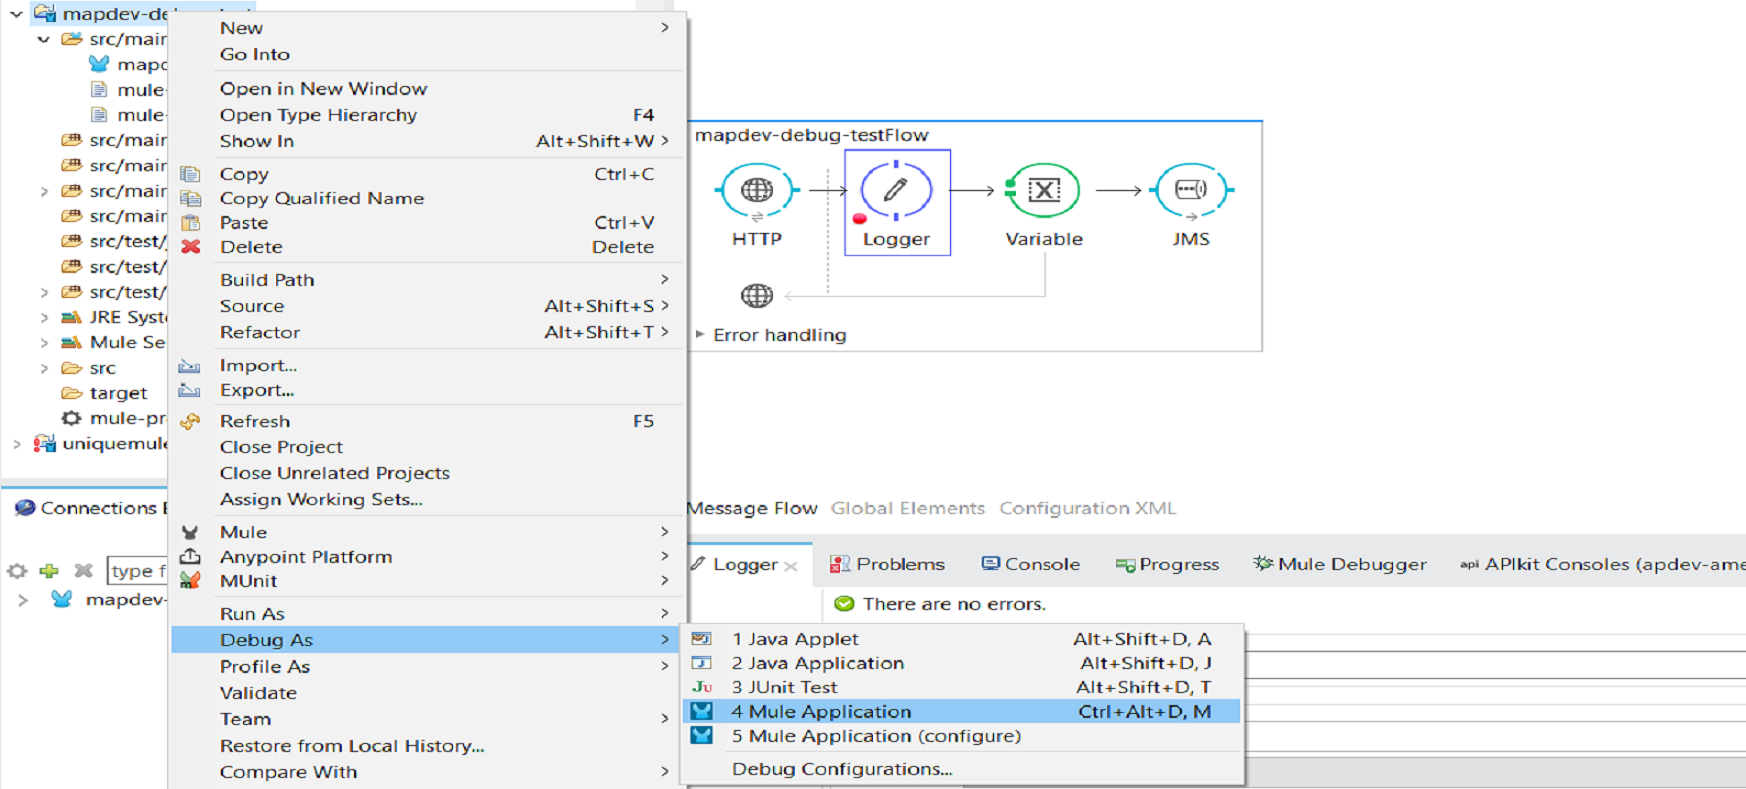
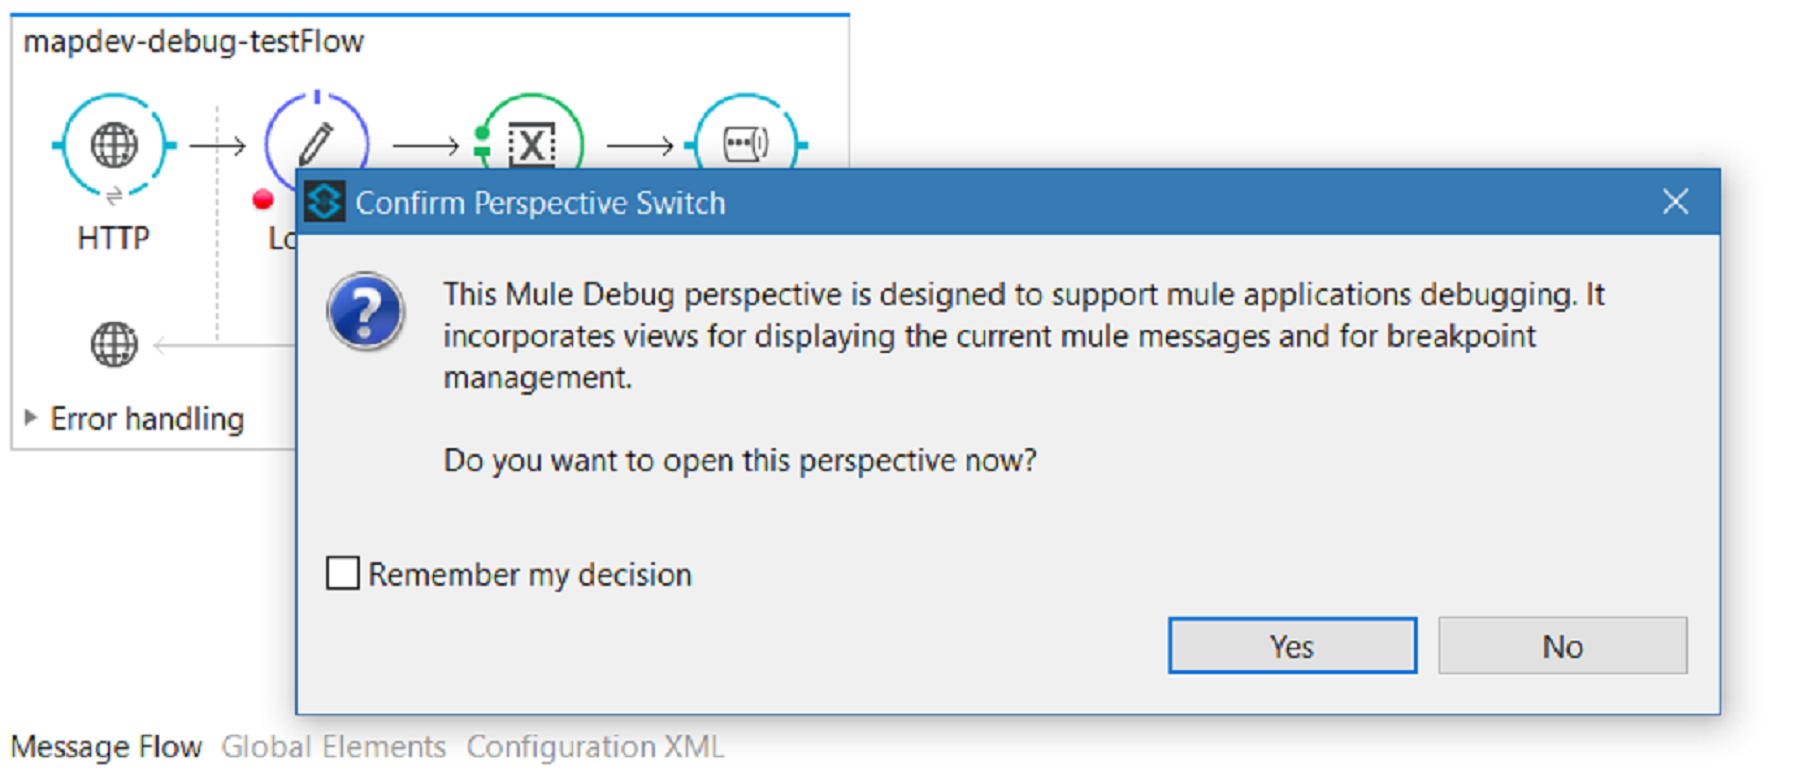
In the Package Explorer pane, right-click on your application, then select Debug As > Mule Application. Studio will start the application in debug mode and display the Confirm Perspective Switch window. Click Yes to confirm.
After enabling the application in debug mode, when the message is sent to the application, it will stop at the first building block where a breakpoint is set.
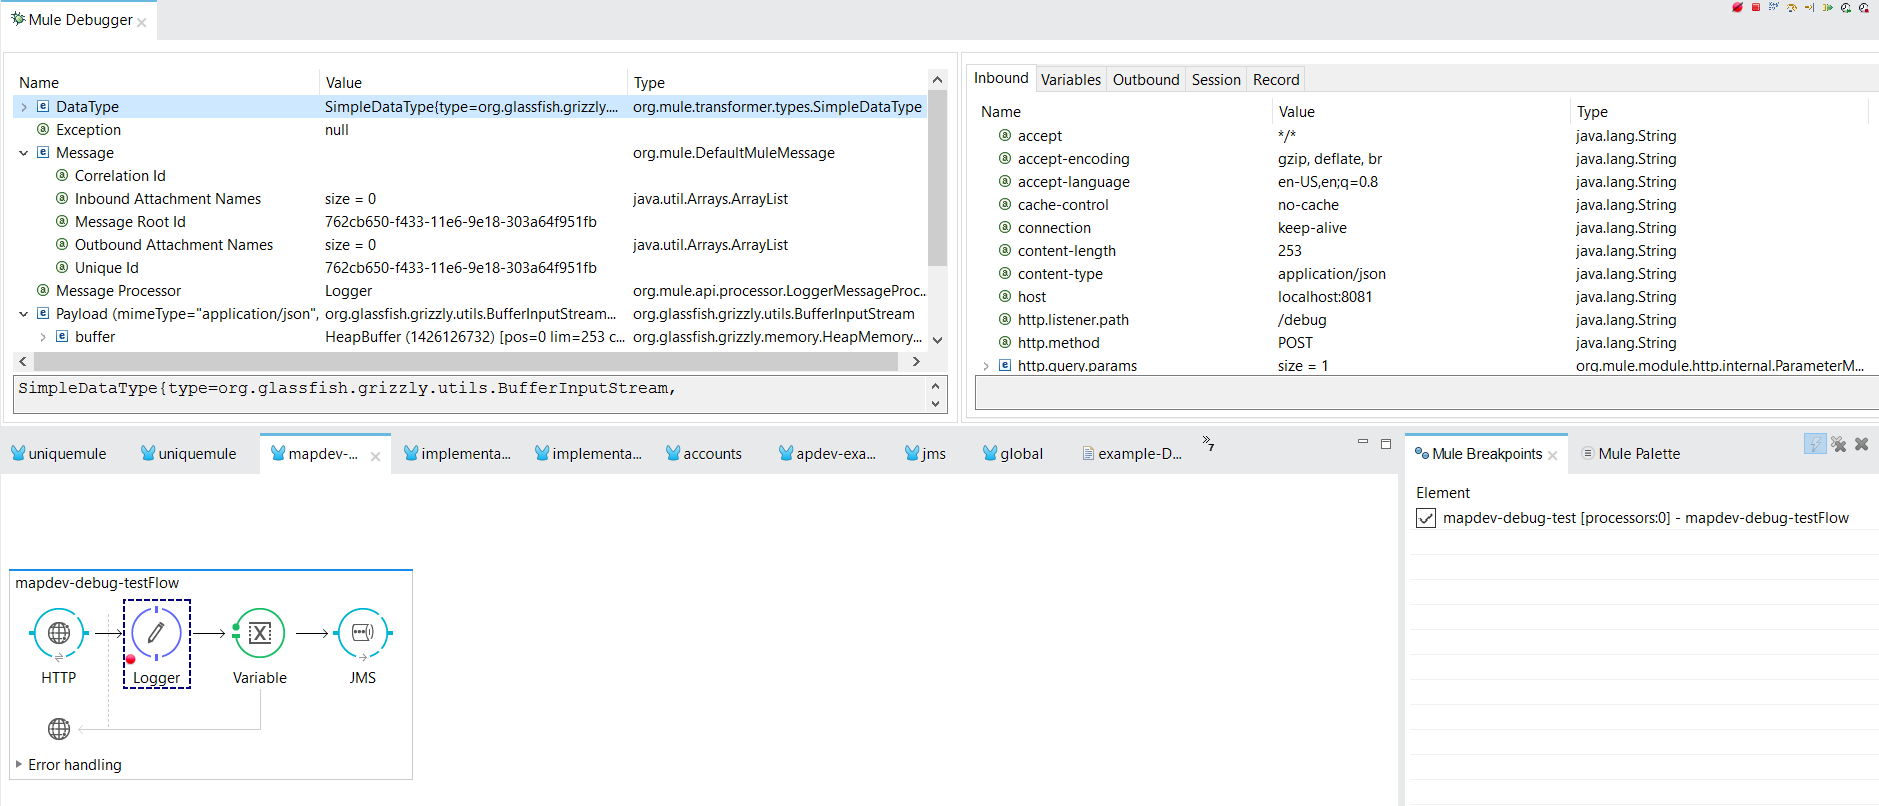
On the left pane of Mule Debugger, you can see message payload and various other properties. The right pane displays various metadata associated with a message like Inbound, Variables, Outbound, Session, and Record.
To go to next step of debugging, click the Run to processor icon as highlighted in below snapshot.
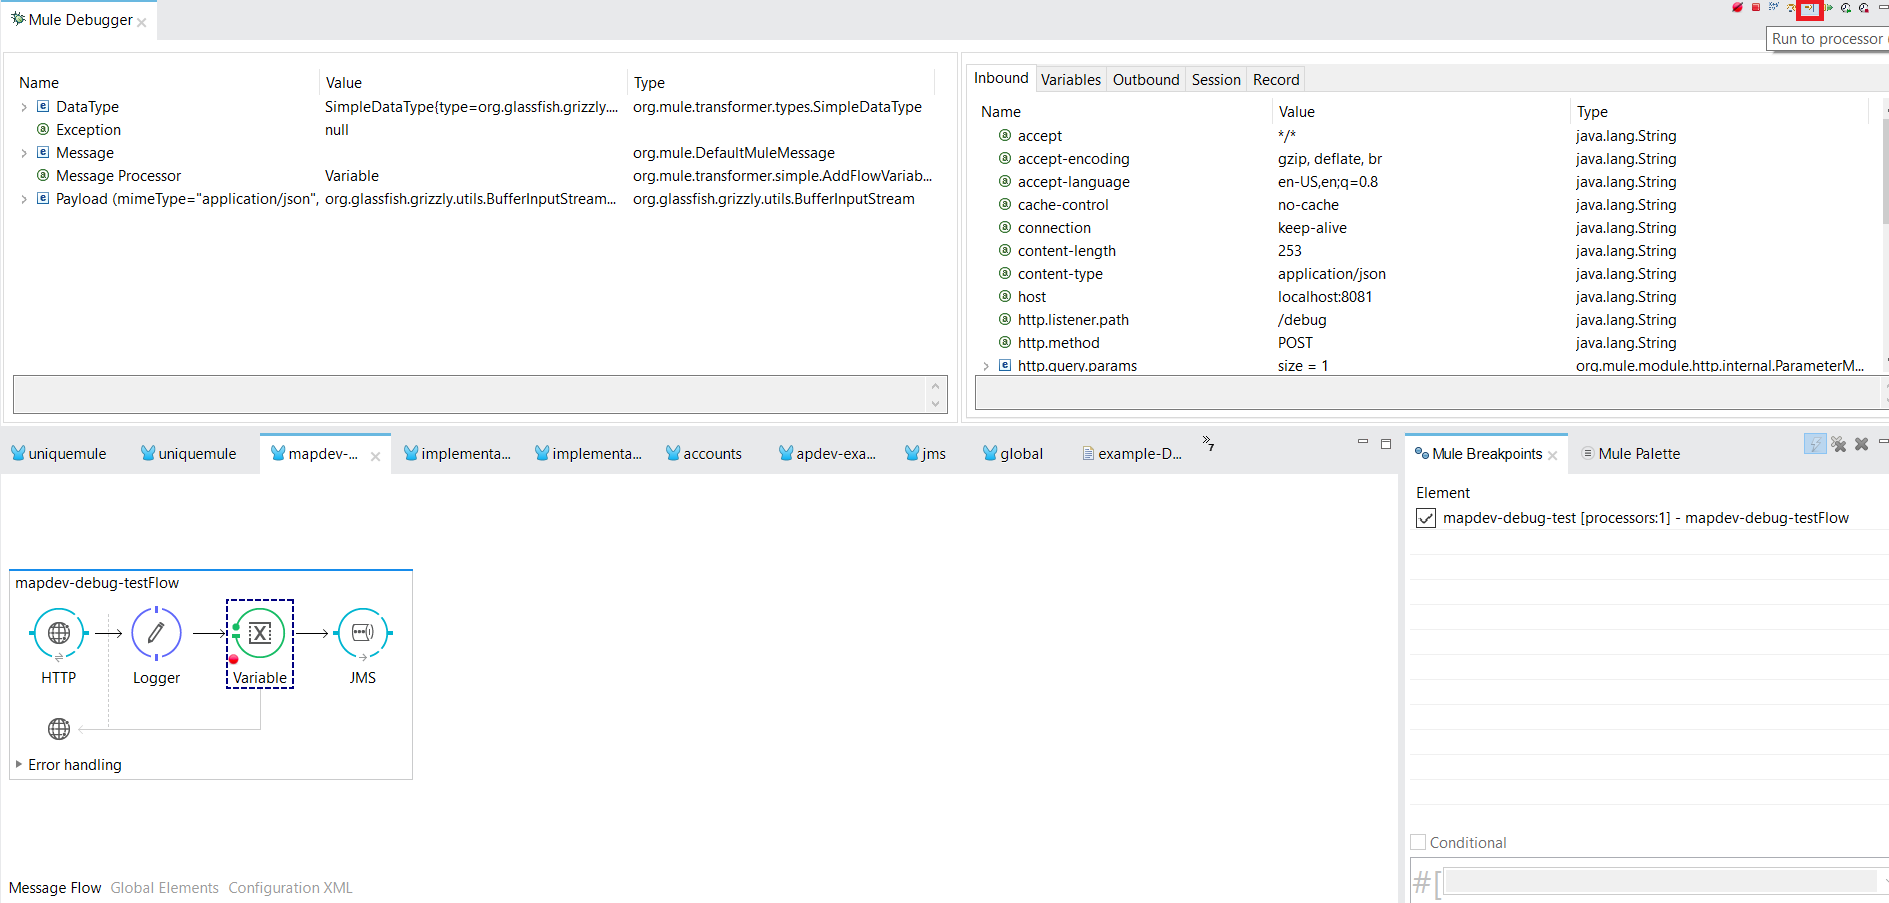
To resume execution, click the Resume icon (see below) or press F8. Your application runs until the message reaches the next breakpoint, if any.

Evaluate Mule Expression
First ensure that studio has stopped flow execution at desired breakpoints. When execution stops breakpoint appeared to surrounded by dotted line canvas and studio popup Mule Debugger View with information.
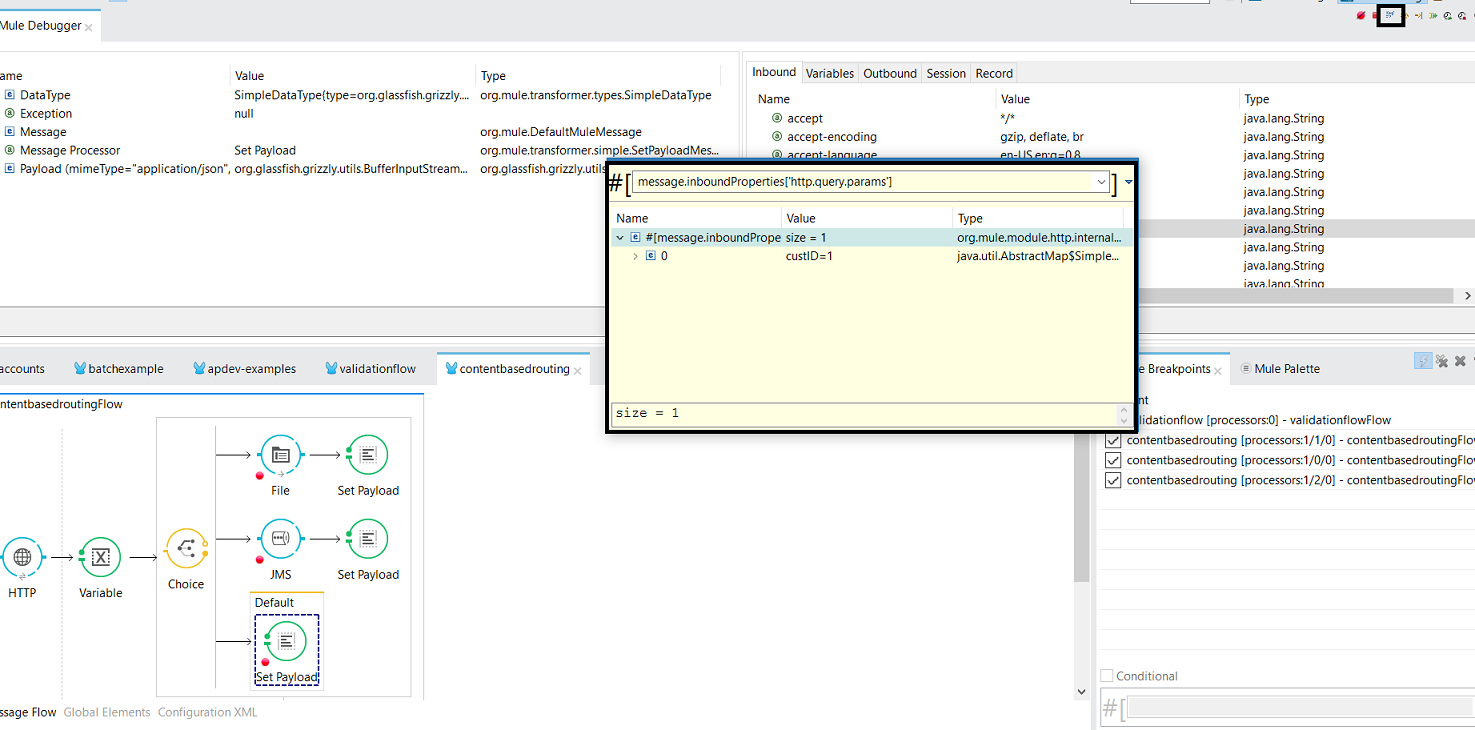
Click on Evaluate Mule Expression and studio will display expression evaluation window.
Type the mule expression you would like to evaluate in provided input field.Studio evaluates the expression, then displays the result in the Name, Value and Type columns. For example, type #[message.inboundProperties['http.query.params']] and press enter.
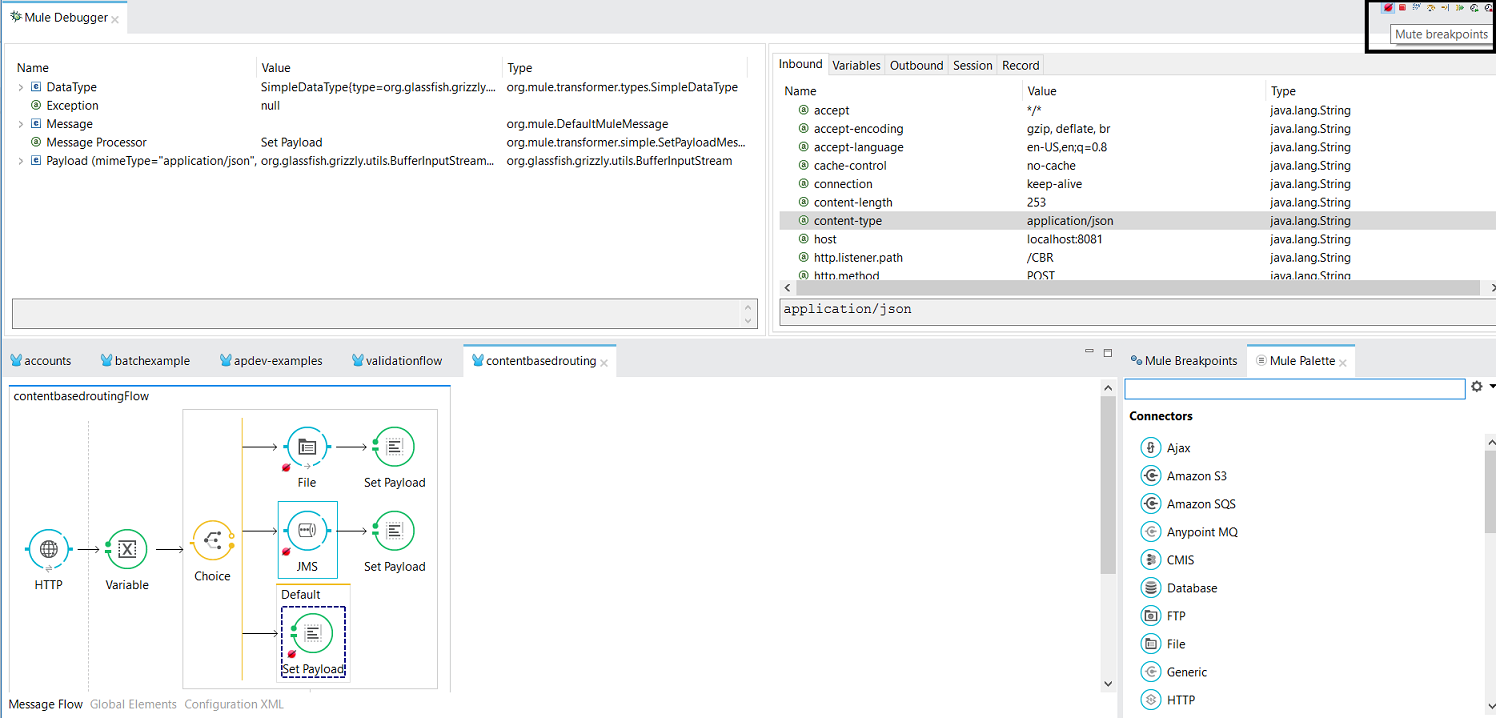
Mute Breakpoints
Mute Breakpoints can be activated in debugger view to temporarily disallow the debugger to stop at your selected breakpoints.
For more details, please see the MuleSoft debugging documentation.
Deploying Mule Application to Anypoint Cloud Hub
CloudHub is an integration platform as a service (iPaaS). Through the Runtime Manager, it allows you to deploy sophisticated cross-cloud integration applications in the cloud, create new APIs on top of existing data sources, integrate on-premise applications with cloud services, and much more.
For deploying the Mule Application to CloudHub, in Package Explorer pane, right-click your application, then select Anypoint Platform > Debug to cloud.
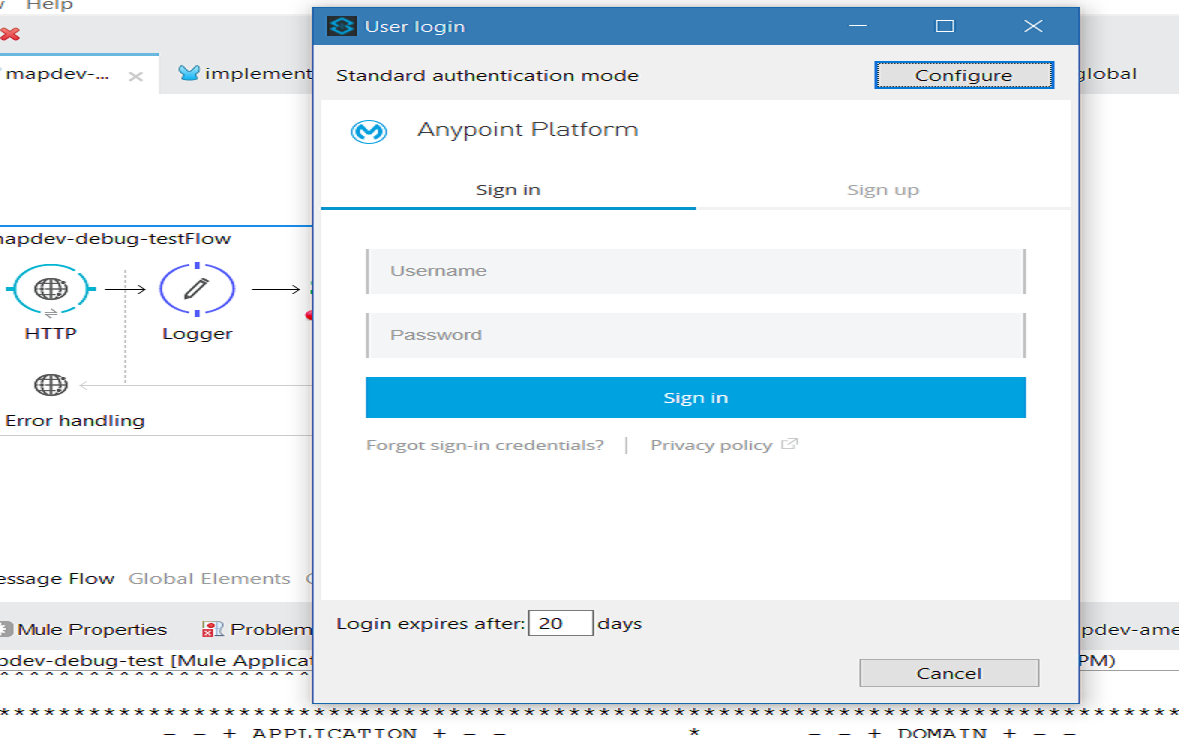
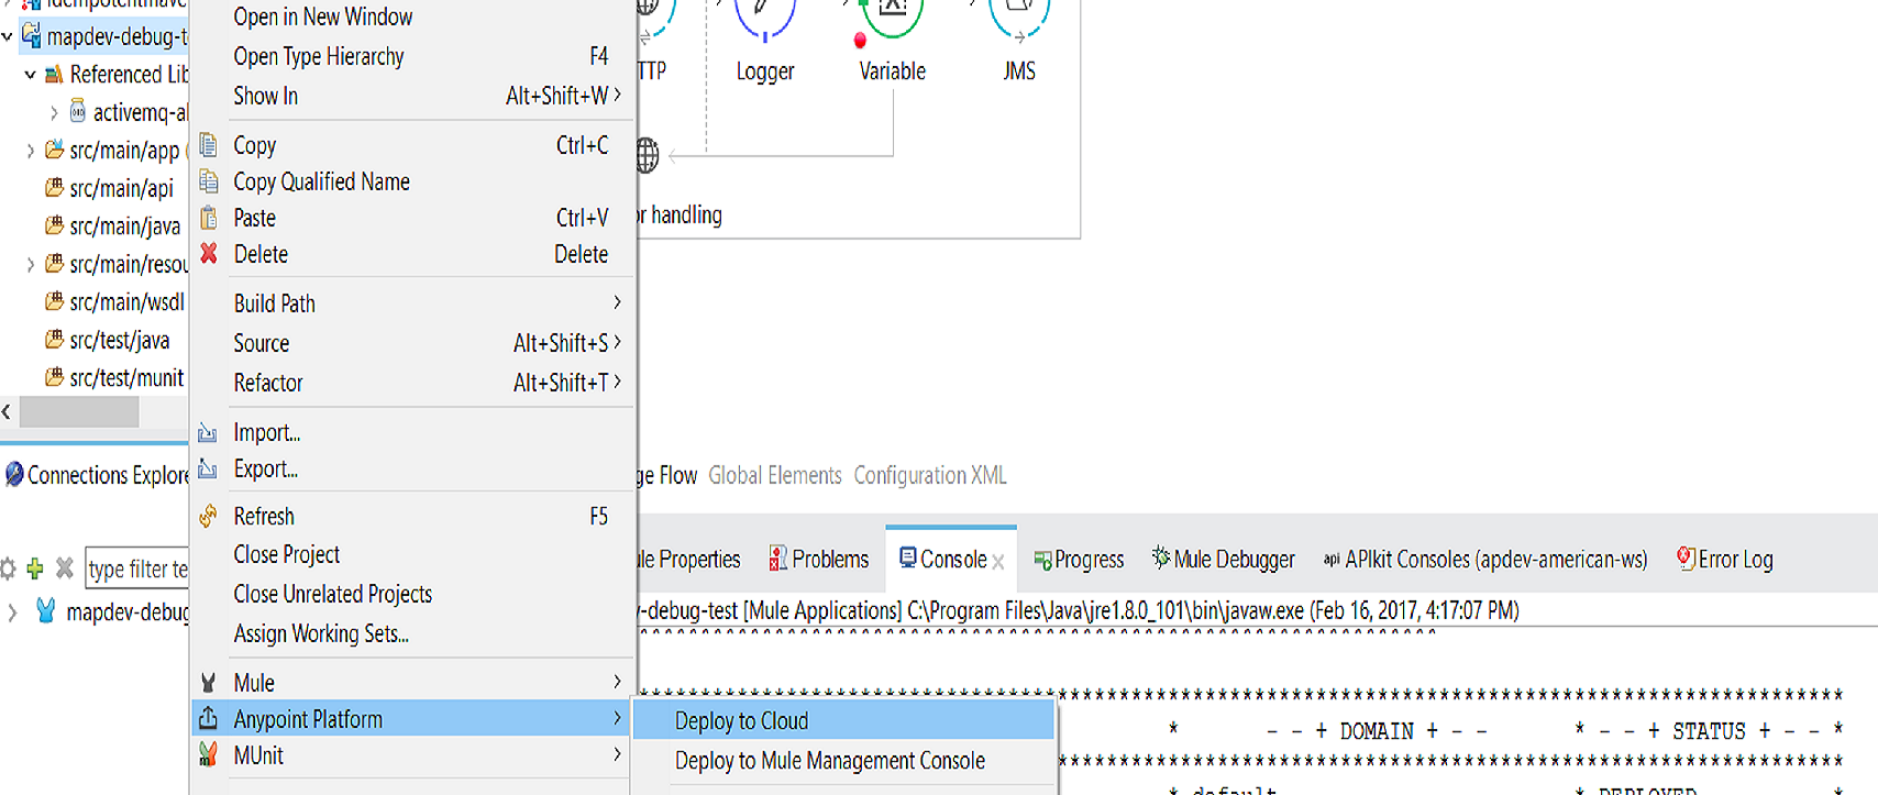 After performing the above steps, it will ask you for authentication. Provide your Anypoint account username and password.
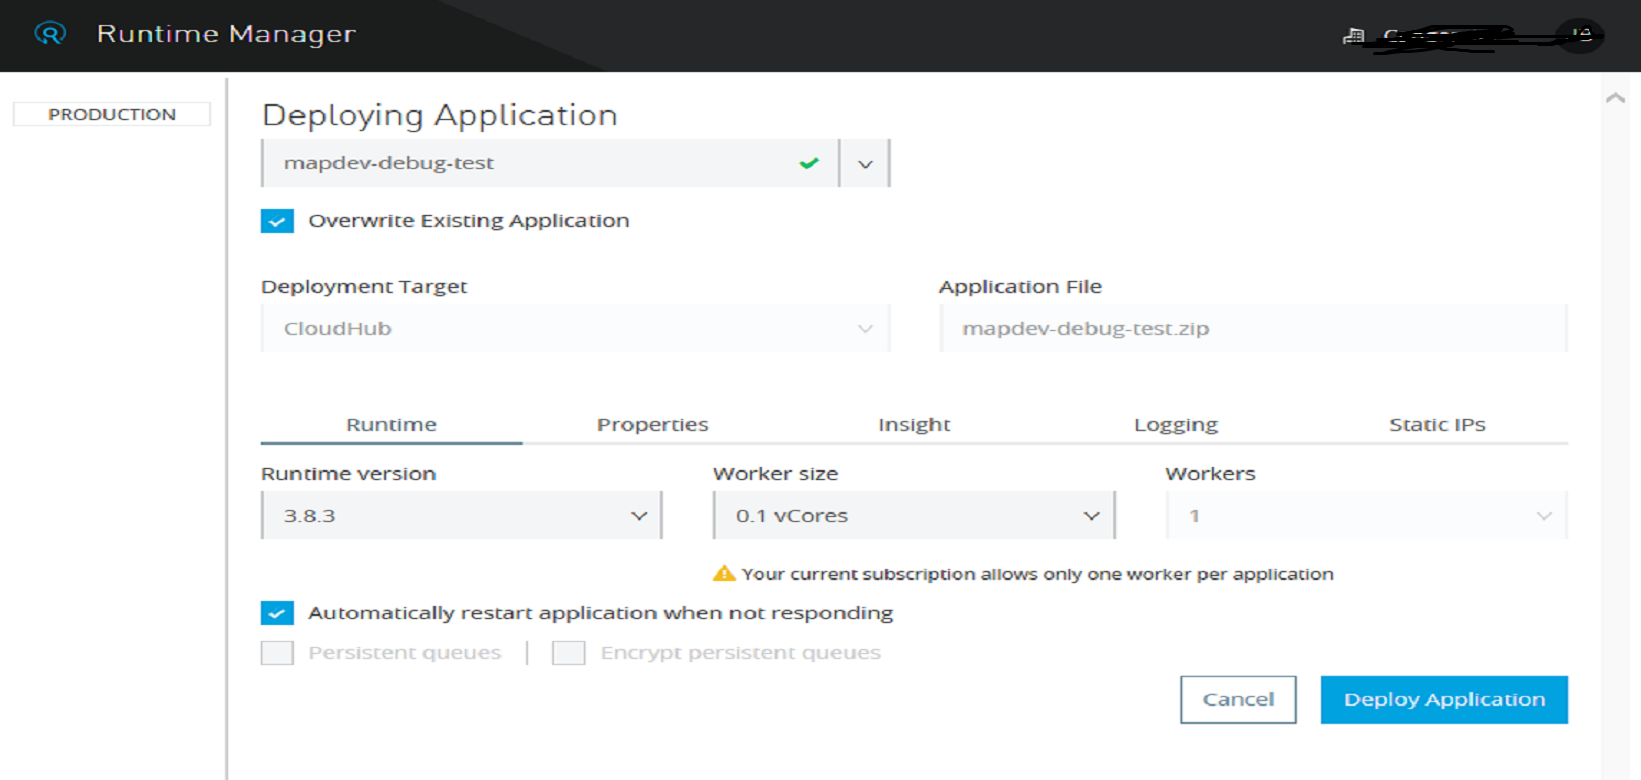
Now, it will ask you to configure Runtime Version, Worker Size, Workers, etc., and click Deploy Application.
Once the application is successfully deployed to CloudHub, a message window will open saying that the application successfully deployed to CloudHub.

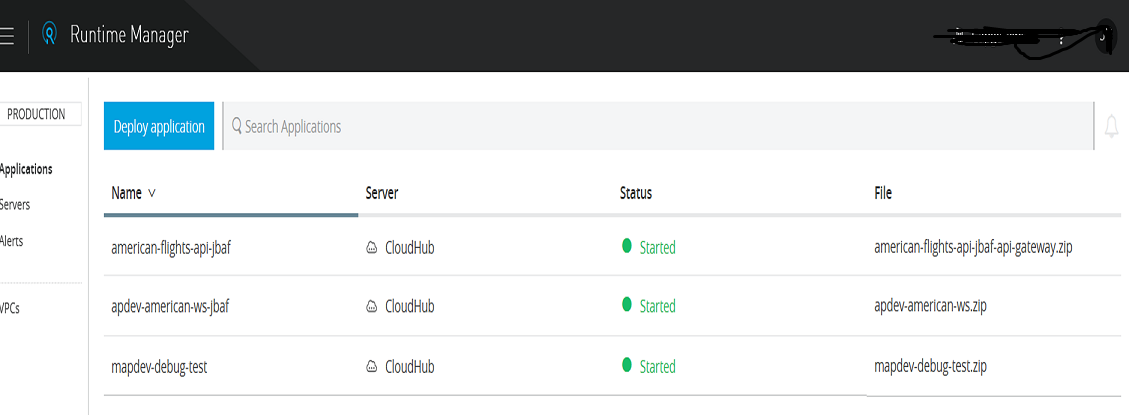
Finally, we can verify if application deployed to CloudHub by logging into Anypoint Platform and navigating to Runtime Manager.
Now, you know how to debug the application and deploy it to CloudHub using Anypoint Studio. It is very easy to deploy and debug applications using Anypoint Studio.
Opinions expressed by DZone contributors are their own.

Comments