Grafana and Prometheus Setup With Strimzi, a.k.a. Kafka on Kubernetes.
A software developer gives a quick tutorial on how to use Strimzi to integrate Prometheus into a Java-based application. Read on to learn more!
Join the DZone community and get the full member experience.
Join For FreeIn this article, we will see how quickly we can setup Grafana and Prometheus with Strimzi. So let us quickly go through the steps required for this setup.
1. Start Minikube.
$ minikube start -p strimzi-prometheus-grafana --cpus=4 --memory='10g'
2. Download Strimzi. We can follow steps mentioned in Strimzi docs.
xxxxxxxxxx
#Download the strimzi-x.y.z.zip file from GitHub.
#Latest release while writing this article is strimzi-0.20.zip.
[chandrashekhar@localhost strimzi-0.20.1]$ pwd
/home/chandrashekhar/SSD/Development_SSD/Streams_RH/strimzi-0.20.1
[chandrashekhar@localhost strimzi-0.20.1]$ kubectl create ns kafka
namespace/kafka created
# Let us set context to kafka namespace so that we don't have to provide namespace for each command.
[chandrashekhar@localhost strimzi-0.20.1]$ kubectl config set-context --current --namespace=kafka
Context "strimzi-prometheus-grafana" modified.
[chandrashekhar@localhost strimzi-0.20.1]$ ls -ltr
total 12
drwxr-xr-x. 6 chandrashekhar chandrashekhar 4096 Dec 14 20:11 install
drwxr-xr-x. 12 chandrashekhar chandrashekhar 4096 Dec 14 20:11 examples
drwxr-xr-x. 3 chandrashekhar chandrashekhar 4096 Dec 14 20:11 docs
[chandrashekhar@localhost strimzi-0.20.1]$ sed -i 's/namespace: .*/namespace: kafka/' install/cluster-operator/*RoleBinding*.yaml
[chandrashekhar@localhost strimzi-0.20.1]$ kubectl apply -f install/cluster-operator/
serviceaccount/strimzi-cluster-operator created
clusterrole.rbac.authorization.k8s.io/strimzi-cluster-operator-namespaced created
rolebinding.rbac.authorization.k8s.io/strimzi-cluster-operator created
--------------
--------------
configmap/strimzi-cluster-operator created
deployment.apps/strimzi-cluster-operator created
[chandrashekhar@localhost strimzi-0.20.1]$ kubectl get pods
NAME READY STATUS RESTARTS AGE
strimzi-cluster-operator-545b7f4bf5-gktrg 0/1 ContainerCreating 0 2m51s
# wait for couple of minutes as it will download the images.
[chandrashekhar@localhost strimzi-0.20.1]$ kubectl get pods
NAME READY STATUS RESTARTS AGE
strimzi-cluster-operator-545b7f4bf5-gktrg 1/1 Running 0 5m48s
[chandrashekhar@localhost strimzi-0.20.1]$
3. Setup the Kafka Cluster now. You can find kafka-ephemeral.yaml with kafkaExporter and metrics configured.
xxxxxxxxxx
[chandrashekhar@localhost strimzi-0.20.1]$ kubectl apply -f kafka-ephemeral.yaml
[chandrashekhar@localhost strimzi-0.20.1]$ kubectl get pods
NAME READY STATUS RESTARTS AGE
my-cluster-entity-operator-7f95fc64b5-wtmz5 3/3 Running 2 4m37s
my-cluster-kafka-0 1/1 Running 0 5m18s
my-cluster-kafka-1 1/1 Running 0 5m18s
my-cluster-kafka-2 1/1 Running 0 5m18s
my-cluster-kafka-exporter-56b65ff8b9-wxzc2 1/1 Running 0 45s
my-cluster-zookeeper-0 1/1 Running 0 13m
my-cluster-zookeeper-1 1/1 Running 0 13m
my-cluster-zookeeper-2 1/1 Running 0 13m
strimzi-cluster-operator-545b7f4bf5-gktrg 1/1 Running 0 29m
[chandrashekhar@localhost strimzi-0.20.1]$
4. Install the Prometheus operator and the Prometheus server instance. Some important modified YAML files can be found in my personnel GitHub link.
x
[chandrashekhar@localhost strimzi-0.20.1]$ curl -s https://raw.githubusercontent.com/coreos/prometheus-operator/master/bundle.yaml | sed -e 's/namespace: .*/namespace: kafka/' > prometheus-operator-deployment.yaml
# First remove line 1811 to 1829 from prometheus-operator-deployment.yaml.
[chandrashekhar@localhost strimzi-0.20.1]$ kubectl apply -f prometheus-operator-deployment.yaml
customresourcedefinition.apiextensions.k8s.io/alertmanagerconfigs.monitoring.coreos.com created
customresourcedefinition.apiextensions.k8s.io/alertmanagers.monitoring.coreos.com created
---------
---------
service/prometheus-operator created
[chandrashekhar@localhost strimzi-0.20.1]$
[chandrashekhar@localhost strimzi-0.20.1]$ kubectl get pods|grep prometheus
prometheus-operator-79cd654746-qr4bf 1/1 Running 0 100s
[chandrashekhar@localhost strimzi-0.20.1]$ find . -name prometheus-additional.yaml
./examples/metrics/prometheus-additional-properties/prometheus-additional.yaml
[chandrashekhar@localhost strimzi-0.20.1]$ kubectl create secret generic additional-scrape-configs --from-file=./examples/metrics/prometheus-additional-properties/prometheus-additional.yaml -n kafka
secret/additional-scrape-configs created
[chandrashekhar@localhost examples]$ cd ..
[chandrashekhar@localhost strimzi-0.20.1]$ find . -name strimzi-pod-monitor.yaml
./examples/metrics/prometheus-install/strimzi-pod-monitor.yaml
[chandrashekhar@localhost strimzi-0.20.1]$
[chandrashekhar@localhost strimzi-0.20.1]$ vi ./examples/metrics/prometheus-install/strimzi-pod-monitor.yaml
# Modify value of namespaceSelector.matchNames property to kafka in strimzi-pod-monitor.yaml. It exists in mutiple locations.
[chandrashekhar@localhost strimzi-0.20.1]$ kubectl apply -f ./examples/metrics/prometheus-install/strimzi-pod-monitor.yaml
podmonitor.monitoring.coreos.com/cluster-operator-metrics created
podmonitor.monitoring.coreos.com/entity-operator-metrics created
podmonitor.monitoring.coreos.com/bridge-metrics created
podmonitor.monitoring.coreos.com/kafka-resources-metrics created
[chandrashekhar@localhost strimzi-0.20.1]$ find . -name prometheus-additional.yaml
./examples/metrics/prometheus-additional-properties/prometheus-additional.yaml
[chandrashekhar@localhost strimzi-0.20.1]$ find . -name prometheus-rules.yaml
./examples/metrics/prometheus-install/prometheus-rules.yaml
[chandrashekhar@localhost strimzi-0.20.1]$ kubectl apply -f ./examples/metrics/prometheus-install/prometheus-rules.yaml
prometheusrule.monitoring.coreos.com/prometheus-k8s-rules created
[chandrashekhar@localhost strimzi-0.20.1]$ find . -name prometheus.yaml
./examples/metrics/prometheus-install/prometheus.yaml
# Make sure that namespace in this prometheus.yaml is set to "kafka" namespace.
[chandrashekhar@localhost strimzi-0.20.1]$ kubectl apply -f ./examples/metrics/prometheus-install/prometheus.yaml
clusterrole.rbac.authorization.k8s.io/prometheus-server created
serviceaccount/prometheus-server created
clusterrolebinding.rbac.authorization.k8s.io/prometheus-server created
prometheus.monitoring.coreos.com/prometheus created
[chandrashekhar@localhost strimzi-0.20.1]$ kubectl get pods|grep prometheus
prometheus-operator-79cd654746-qr4bf 1/1 Running 0 11m
prometheus-prometheus-0 2/2 Running 1 3m21s
[chandrashekhar@localhost strimzi-0.20.1]$
5. Check if Strimzi metrics are available.
xxxxxxxxxx
[chandrashekhar@localhost strimzi-0.20.1]$ kubectl get pods|grep exporter
my-cluster-kafka-exporter-56b65ff8b9-wxzc2 1/1 Running 0 25m
[chandrashekhar@localhost strimzi-0.20.1]$ kubectl port-forward my-cluster-kafka-exporter-56b65ff8b9-wxzc2 9404:9404 -n kafka
Forwarding from 127.0.0.1:9404 -> 9404
Forwarding from [::1]:9404 -> 9404
# In a different shell execute
[chandrashekhar@localhost strimzi-0.20.1]$ curl http://localhost:9404/metrics|grep kafka_
% Total % Received % Xferd Average Speed Time Time Time Current
Dload Upload Total Spent Left Speed
100 5571 100 5571 0 0 81926 0 --:--:-- --:--:-- --:--:-- 81926
# HELP kafka_brokers Number of Brokers in the Kafka Cluster.
# TYPE kafka_brokers gauge
kafka_brokers 3
# HELP kafka_exporter_build_info A metric with a constant '1' value labeled by version, revision, branch, and goversion from which kafka_exporter was built.
# TYPE kafka_exporter_build_info gauge
kafka_exporter_build_info{branch="HEAD",goversion="go1.10.3",revision="830660212e6c109e69dcb1cb58f5159fe3b38903",version="1.2.0"} 1
[chandrashekhar@localhost strimzi-0.20.1]$
6. Now setup Grafana.
x
[chandrashekhar@localhost strimzi-0.20.1]$ find . -name grafana.yaml
./examples/metrics/grafana-install/grafana.yaml
[chandrashekhar@localhost strimzi-0.20.1]$ kubectl apply -f ./examples/metrics/grafana-install/grafana.yaml
deployment.apps/grafana created
service/grafana created
# Prometheus service which will be used when we set up Grafana dashboards.
[chandrashekhar@localhost strimzi-0.20.1]$ kubectl get svc|grep prometheus
prometheus-operated ClusterIP None <none> 9090/TCP 10h
prometheus-operator ClusterIP None <none> 8080/TCP 10h
[chandrashekhar@localhost strimzi-0.20.1]$ kubectl get pods|grep grafana
grafana-7b7bfd6ffc-llf88 1/1 Running 1 6m32s
[chandrashekhar@localhost strimzi-0.20.1]$ kubectl get svc|grep grafana
grafana ClusterIP 10.98.232.101 <none> 3000/TCP 8m8s
[chandrashekhar@localhost strimzi-0.20.1]$ kubectl port-forward prometheus-prometheus-0 9090:9090
Forwarding from 127.0.0.1:9090 -> 9090
Forwarding from [::1]:9090 -> 9090
[chandrashekhar@localhost strimzi-0.20.1]$ kubectl port-forward grafana-7b7bfd6ffc-llf88 3000:3000
Forwarding from 127.0.0.1:3000 -> 3000
Forwarding from [::1]:3000 -> 3000
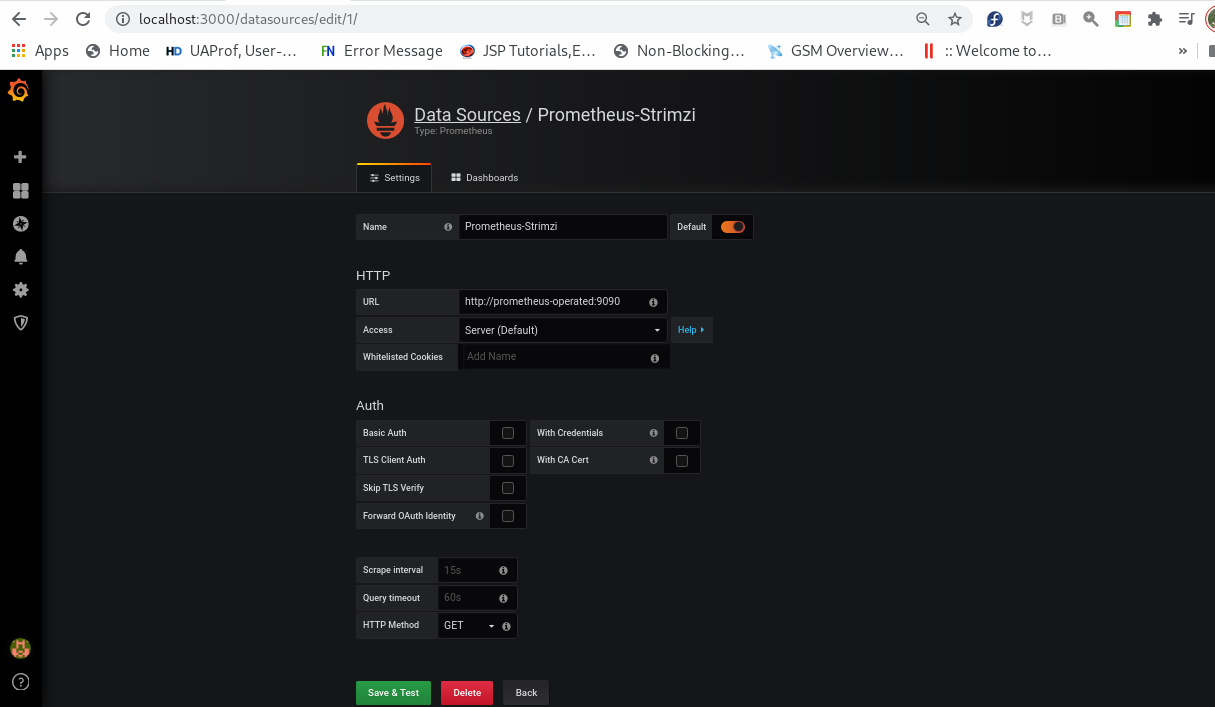
7. Connect Grafana with Prometheus as a datasource. Note that in the previous step, we found that the Prometheus service is prometheus-operated on port 9090. Grafana will use this URL to scrap the Prometheus server.
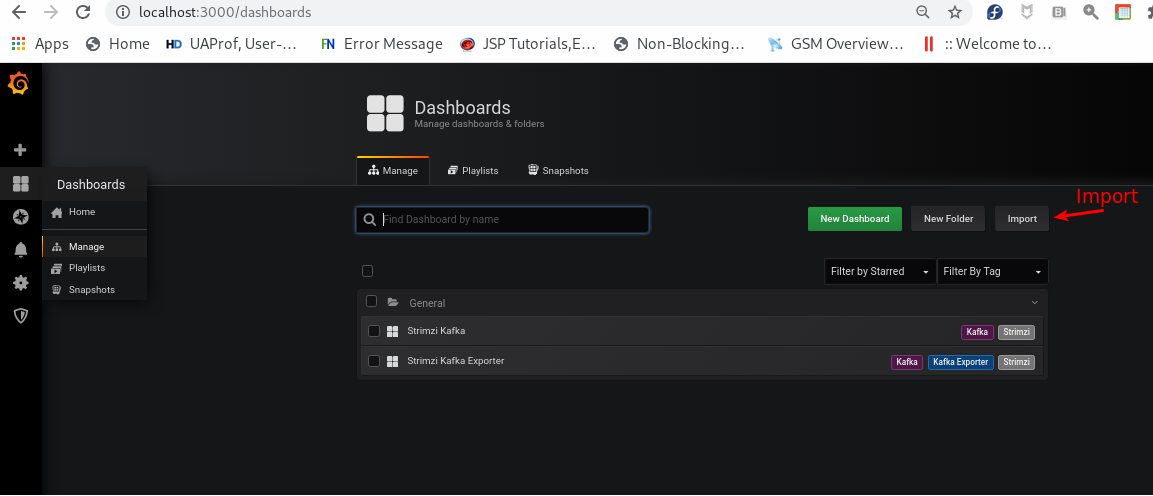
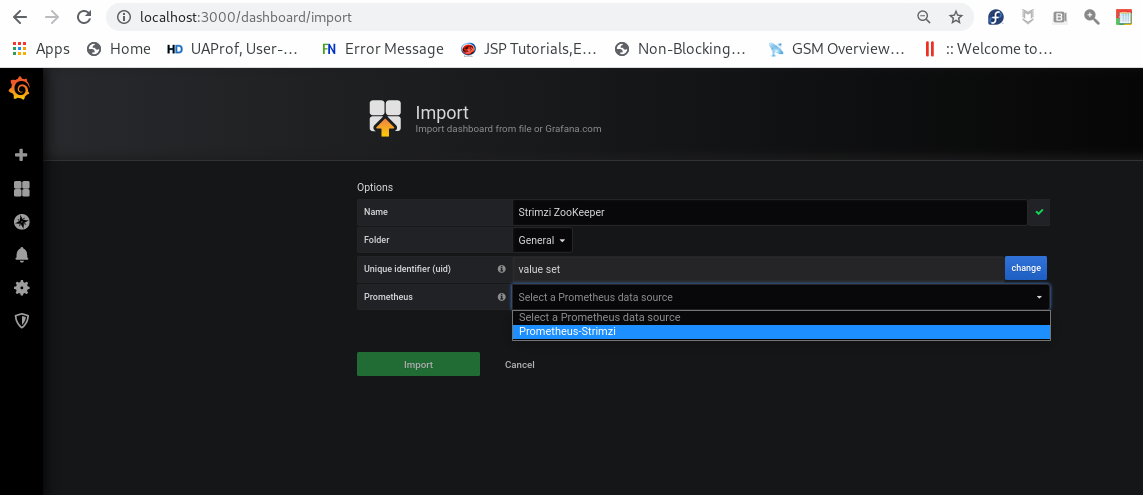
8. Import Dashboard: In the "examples/metrics/grafana-dashboards" file, there are samples available for the Grafana Dashboard; we can reuse them.
xxxxxxxxxx
[chandrashekhar@localhost grafana-dashboards]$ pwd
/home/chandrashekhar/SSD/Development_SSD/Streams_RH/strimzi-0.20.1/examples/metrics/grafana-dashboards
[chandrashekhar@localhost grafana-dashboards]$ ls -ltr
total 352
-rw-r--r--. 1 chandrashekhar chandrashekhar 35654 Dec 14 20:11 strimzi-zookeeper.json
-rw-r--r--. 1 chandrashekhar chandrashekhar 39175 Dec 14 20:11 strimzi-operators.json
-rw-r--r--. 1 chandrashekhar chandrashekhar 17099 Dec 14 20:11 strimzi-kafka-mirror-maker-2.json
-rw-r--r--. 1 chandrashekhar chandrashekhar 68748 Dec 14 20:11 strimzi-kafka.json
-rw-r--r--. 1 chandrashekhar chandrashekhar 34571 Dec 14 20:11 strimzi-kafka-exporter.json
-rw-r--r--. 1 chandrashekhar chandrashekhar 27385 Dec 14 20:11 strimzi-kafka-connect.json
-rw-r--r--. 1 chandrashekhar chandrashekhar 73193 Dec 14 20:11 strimzi-kafka-bridge.json
-rw-r--r--. 1 chandrashekhar chandrashekhar 50404 Dec 14 20:11 strimzi-cruise-control.json
[chandrashekhar@localhost grafana-dashboards]$
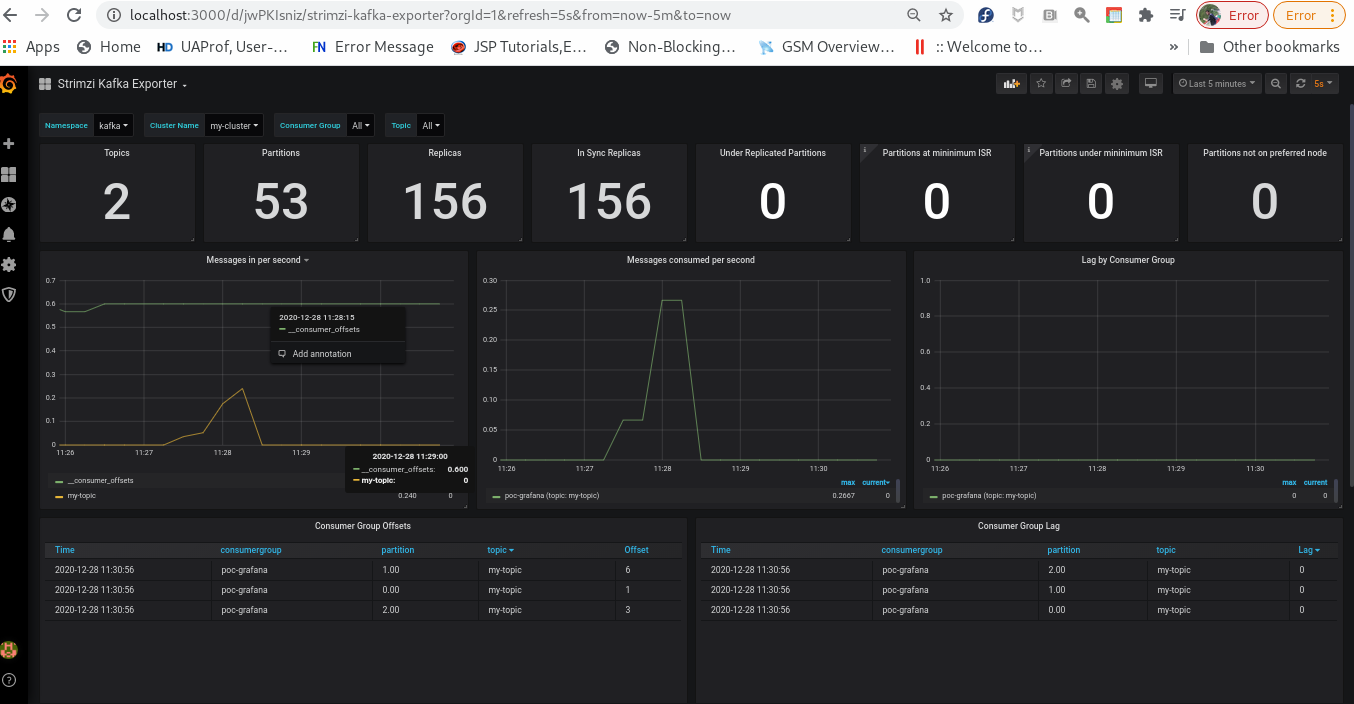
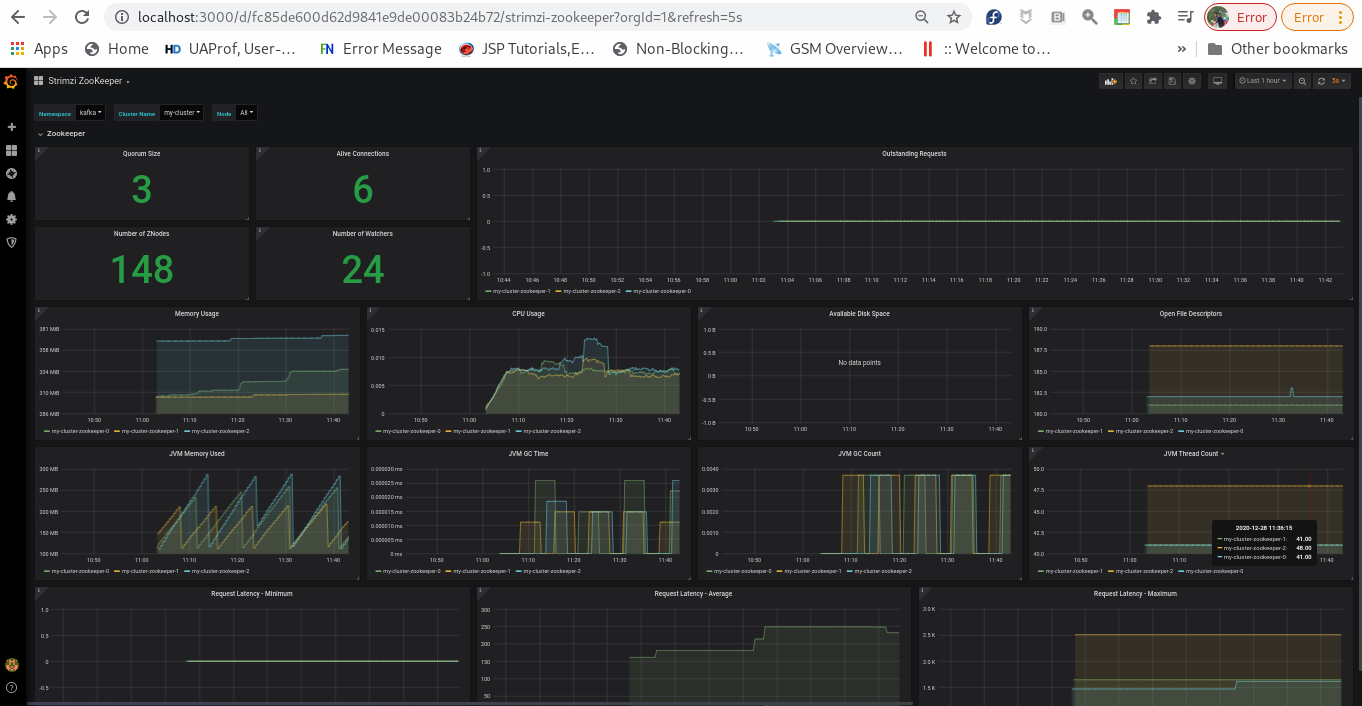
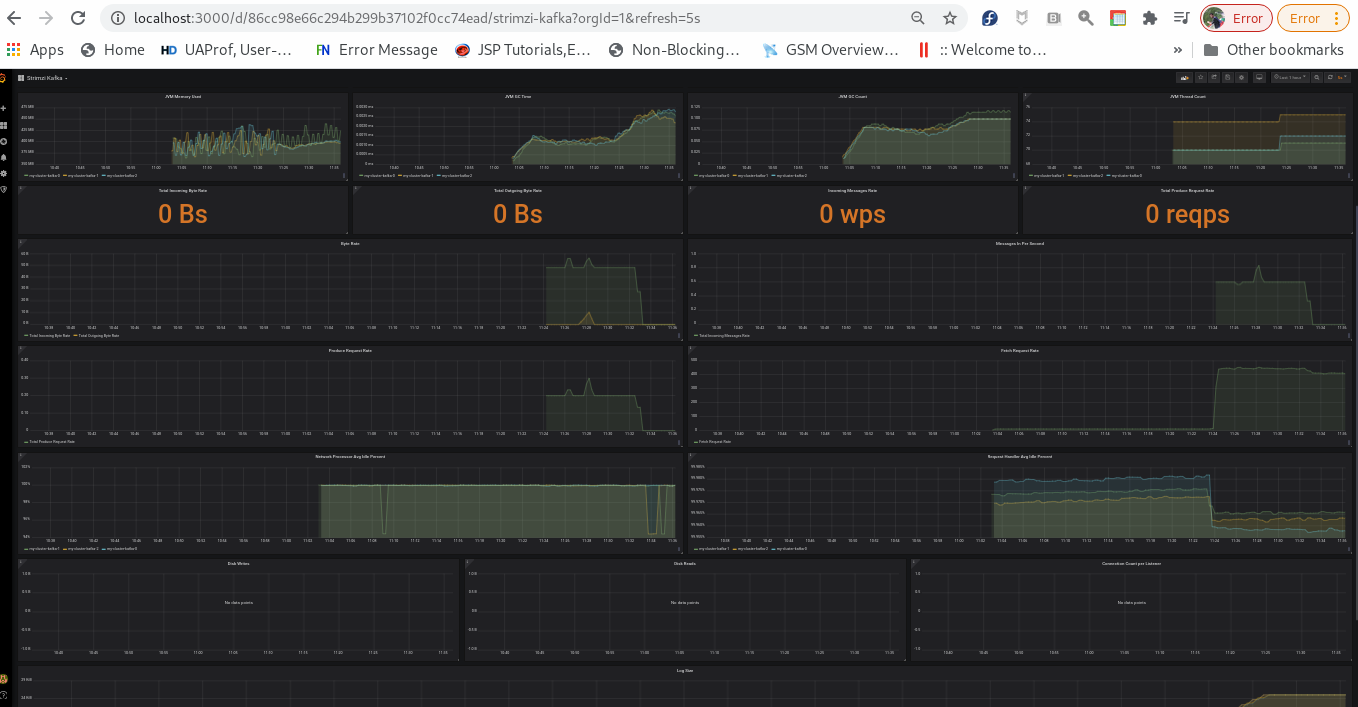
I used strimzi-zookeeper.json, strimzi-kafka.json, and strimzi-kafka-exporter.json for this demonstration.
9. The below allows you to send/receive traffic in Kafka Brokers:
#create topic
[chandrashekhar@localhost strimzi-0.20.1]$ less topic.yaml
apiVersion: kafka.strimzi.io/v1beta1
kind: KafkaTopic
metadata:
name: my-topic
labels:
strimzi.io/cluster: "my-cluster"
spec:
partitions: 3
replicas: 2
[chandrashekhar@localhost strimzi-0.20.1]$ kubectl apply -f topic.yaml
[chandrashekhar@localhost strimzi-0.20.1]$ kubectl exec my-cluster-kafka-0 -- bin/kafka-topics.sh --list --bootstrap-server my-cluster-kafka-bootstrap:9092
my-topic
[chandrashekhar@localhost strimzi-0.20.1]$ kubectl -n kafka exec --stdin --tty my-cluster-kafka-0 -- bash
[kafka@my-cluster-kafka-0 bin]$ ./kafka-console-producer.sh --bootstrap-server 0.0.0.0:9092 --topic my-topic
>hey
>csp
>1
>2
>3
>4
# In different terminal we can start consumer thread.
[chandrashekhar@localhost strimzi-0.20.1]$ kubectl -n kafka exec --stdin --tty my-cluster-kafka-0 -- bin/kafka-console-consumer.sh --bootstrap-server 0.0.0.0:9092 --group poc-grafana --topic my-topic
hey
csp
1
2
3
4
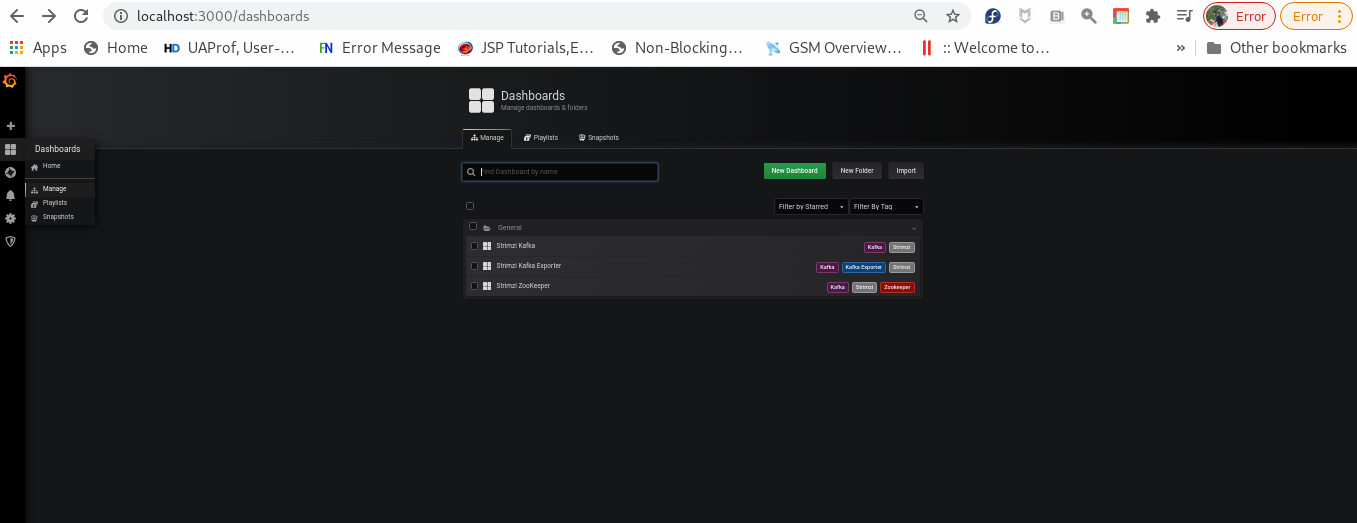
10. Finally, we can view all dashboards with runtime changes.
That's it guys. I hope you find it helpful. There is another article for Prometheus integrations with Java applications which you may find helpful too.
Opinions expressed by DZone contributors are their own.

Comments