Getting Started With Prometheus Workshop: Introduction to the Query Language
Interested in open-source observability? Learn about Prometheus Query Language and how to set up a demo project to provide more realistic data for querying.
Join the DZone community and get the full member experience.
Join For FreeAre you looking to get away from proprietary instrumentation? Are you interested in open-source observability but lack the knowledge to just dive right in?
This workshop is for you, designed to expand your knowledge and understanding of open-source observability tooling that is available to you today.
Dive right into a free, online, self-paced, hands-on workshop introducing you to Prometheus. Prometheus is an open-source systems monitoring and alerting tool kit that enables you to hit the ground running with discovering, collecting, and querying your observability today. Over the course of this workshop, you will learn what Prometheus is, what it is not, install it, start collecting metrics, and learn all the things you need to know to become effective at running Prometheus in your observability stack.
Previously, I shared an introduction to Prometheus and that installing Prometheus has free online workshop labs. In this article, you'll continue your journey with an introduction to the Prometheus query language, also known as PromQL.
Your learning path continues with an introduction to PromQL. Note this article is only a short summary, so please see the complete lab found online here to work through it in its entirety yourself:
The following is a short overview of what is in this specific lab of the workshop. Each lab starts with a goal. In this case, it is fairly simple: This lab introduces the Prometheus Query Language (PromQL) and sets up a demo project to provide more realistic data for querying.
The lab covers what PromQL is, how to test a vendor for open standards compliance with PromQL, discusses the architecture, covers definitions and use cases, and finally, walks you through installing a services demo project to provide Prometheus with a target to scrape for your metrics data collection.
Introduction to PromQL
The question of why PromQL is even needed is covered right from the beginning. A query language is needed by Prometheus to be able to send requests to the stored metrics data, allowing users to gain ad-hoc insights, build visualizations and dashboards from this data, and be able to report (alert) when incoming data indicates that systems are not performing as desired.

This language is called PromQL and provides an open standard unified way of selecting, aggregating, transforming, and computing the collected time series data. Note that this language provides only READ access to the collected metrics data, while Prometheus offers a different path to WRITE access.
I also touch on where to find the PromQL compliance testing project and show how it's used to validate 100% open standard compliance with a vendor like Chronosphere.
The Architecture
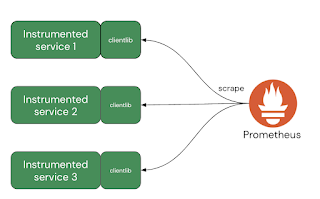
When discussing any technology, seeing it in action is one thing, but understanding how it works visually is paramount. This section works from a high-level look at Prometheus to drilling down into how the query engine fits and works to provide your PromQL ad-hoc queries, dashboards, and alerts with insights into your metrics data collection.
Definitions
Before diving any deeper, I pause to point out the baseline definitions of many of the terms that will consistently cross the screen when talking about PromQL and queries. Defining what is a rule, an alert, a query, a recording rule, aggregation, and filtering all pass in review.
Use Cases
To understand how PromQL can be of service, I take you through the various use cases that define its existence. From ad-hoc querying, dashboards, alerting, and automation. Each one is explained using visual examples of them in action where possible.
Services Demo![Prometheus services demo]()
Finally, before closing out this lab, I help you to install a services demo that is used to generate synthetic metrics data for Prometheus to scrape on your local machine. This will make the queries you run later feel more realistic and offer broader examples for you to digest than just using the self-scraping metrics data from your Prometheus instance.
Missed Previous Labs?
This is one lab in the more extensive free online workshop. Feel free to start from the very beginning of this workshop here if you missed anything previously:
You can always proceed at your own pace and return any time you like as you work your way through this workshop. Just stop and later restart Perses to pick up where you left off.
Coming Up Next
I'll be taking you through the following lab in this workshop where you'll continue learning about the PromQL using basic queries to gain insights into your collected metrics. Stay tuned for more hands-on material to help you with your cloud-native observability journey.
Published at DZone with permission of Eric D. Schabell. See the original article here.
Opinions expressed by DZone contributors are their own.


Comments