Exploring Debugging in Apache Airflow: Strategies and Solutions
This article delves into effective debugging techniques in Apache Airflow, focusing on troubleshooting stuck tasks and other common issues.
Join the DZone community and get the full member experience.
Join For FreeApache Airflow is an open-source platform that allows you to programmatically author, schedule, and monitor workflows. It uses Python as its programming language and offers a flexible architecture suited for both small-scale and large-scale data processing. The platform supports the concept of Directed Acyclic Graphs to define workflows, making it easy to visualize complex data pipelines. However, as with any sophisticated platform, users can sometimes encounter challenges, particularly when tasks don't execute as expected. This article delves into effective debugging techniques in Apache Airflow, focusing on troubleshooting stuck tasks and other common issues to enhance your workflow reliability and efficiency.
Understanding Apache Airflow's Architecture
- Web server: A user interface for managing and monitoring workflows.
- Scheduler: Determines when and how tasks should be executed based on DAG definitions.
- Executor: Executes tasks as directed by the scheduler.
- Metadata database: Stores metadata on workflows, tasks, and their execution status.
- DAGs: Directed Acyclic Graphs that define the workflows in Python code.
Core Component Roles
- Web server: Allows users to view and interact with the system through a web application.
- Scheduler: Scans DAGs and schedules tasks based on timing or triggers.
- Executor: Takes tasks from the queue and runs them, supporting various execution environments.
- Metadata database: Acts as the central information repository for the state of tasks and workflows.
- DAGs: The blueprint of the workflow that Airflow needs to execute, defining tasks and their dependencies.
Debugging Stuck Tasks in Apache Airflow
One common issue Airflow users encounter is stuck tasks—tasks that neither fail nor complete, disrupting the workflow's progression. Here are strategies to debug and resolve such issues:
1. Check the Logs
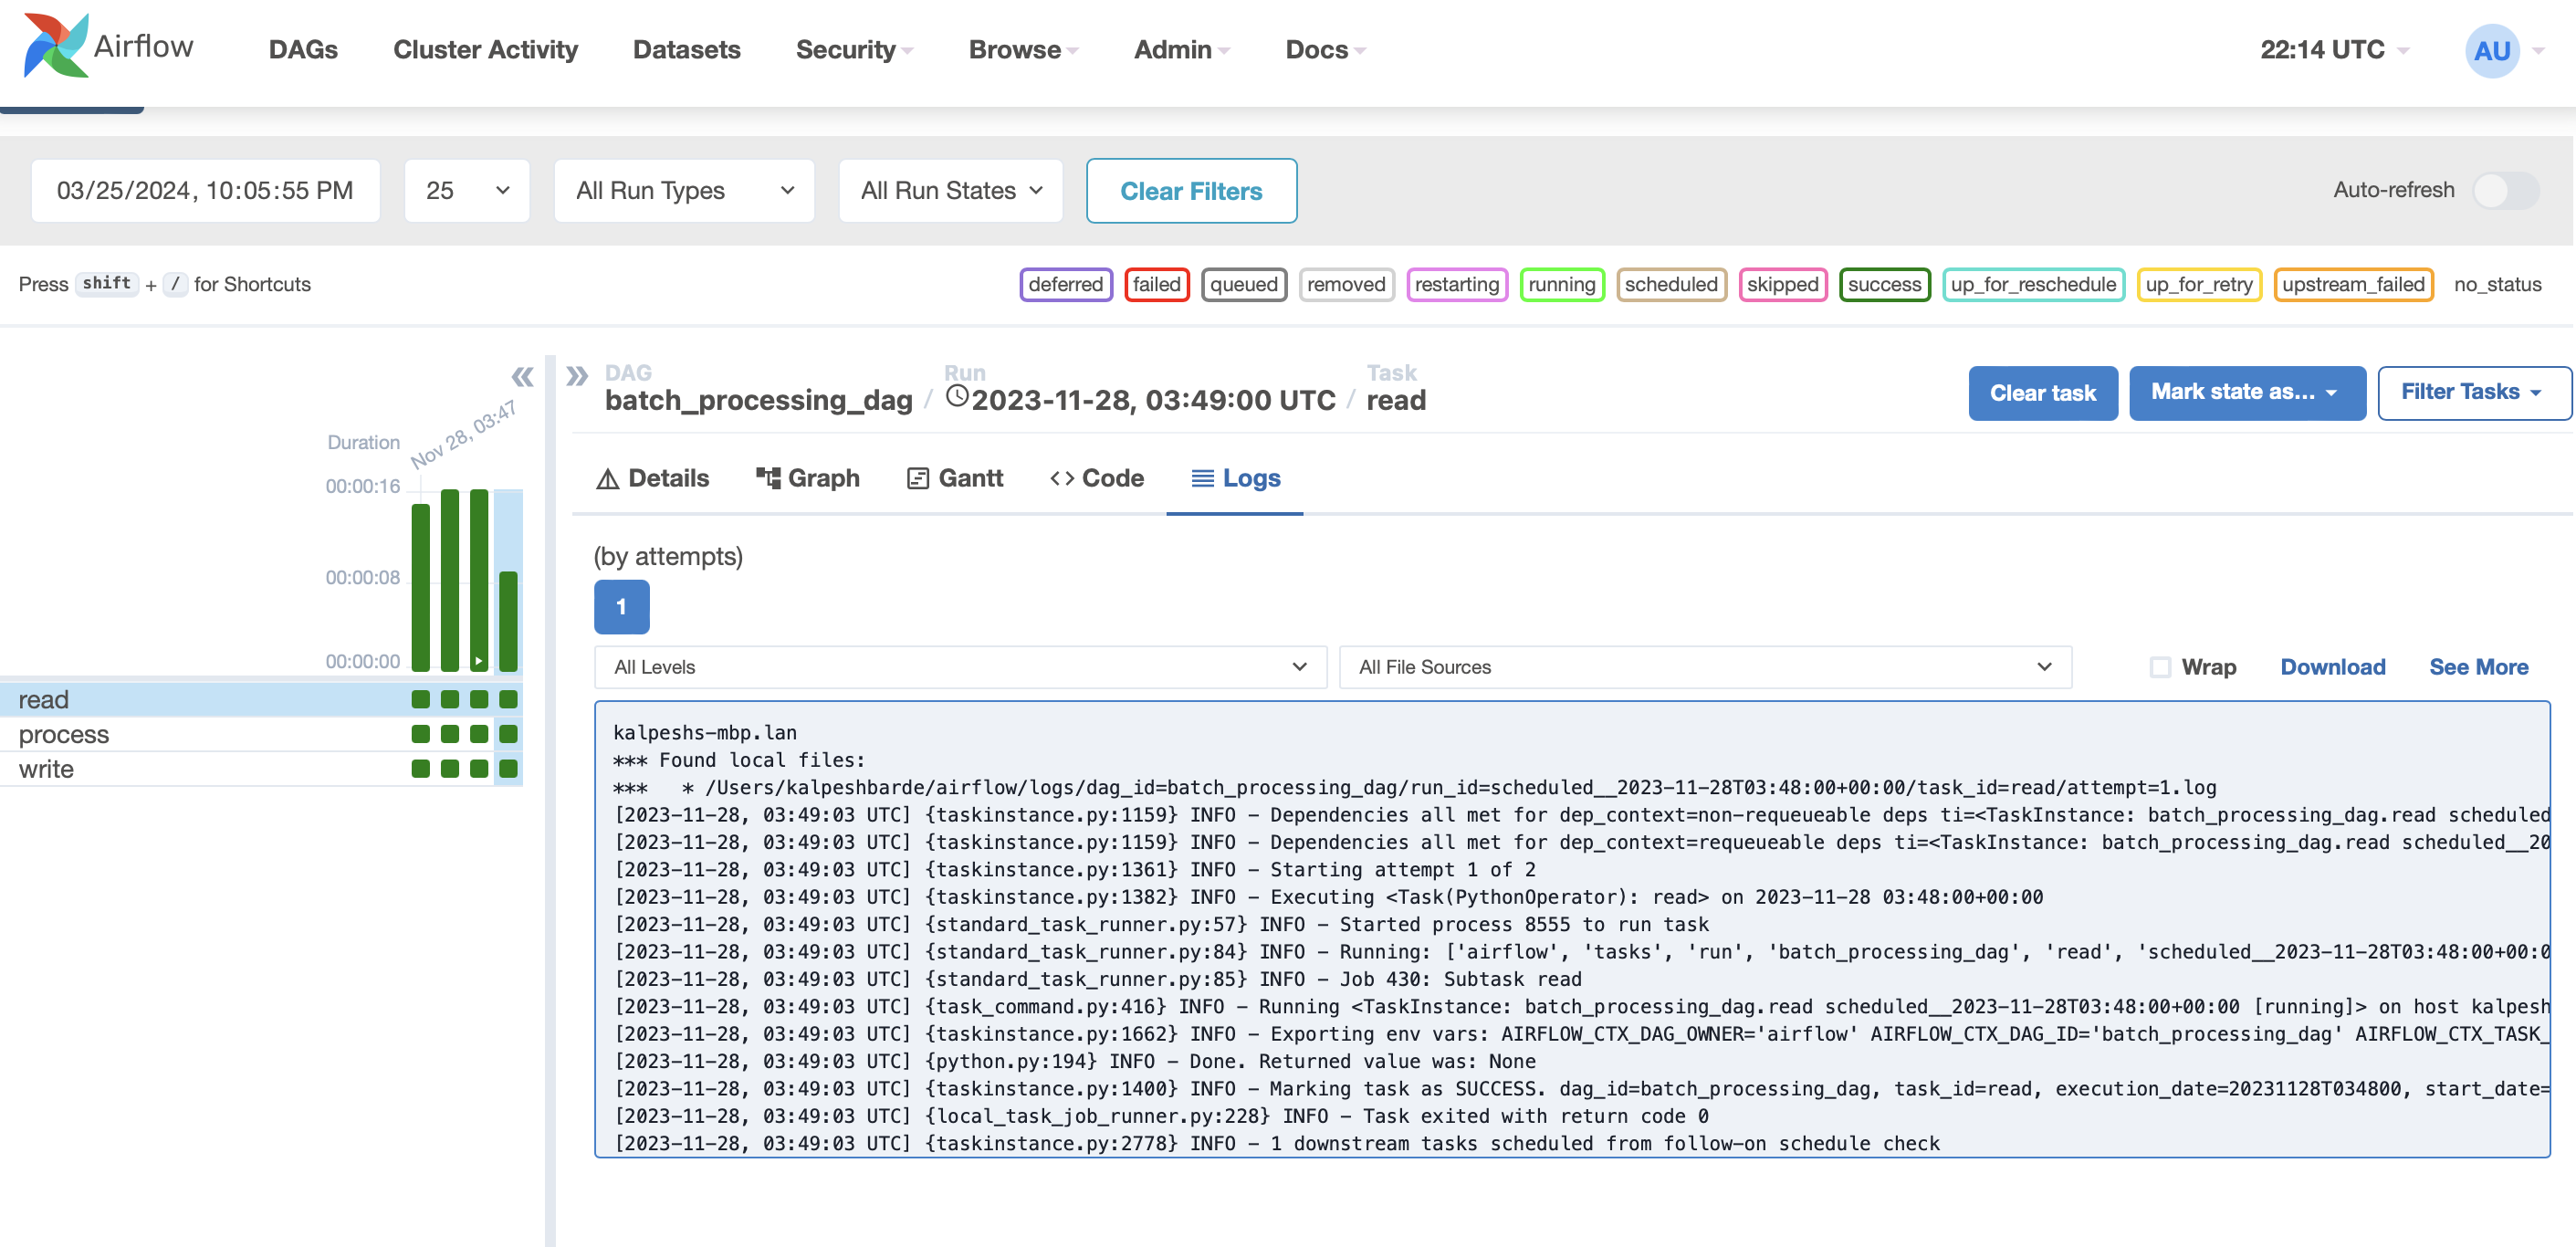
The first step in debugging stuck tasks is to examine the task logs. Airflow's UI provides easy access to these logs, offering insights into the task's execution.
- Open Airflow web UI: Navigate to the Airflow web UI in your browser (
http://localhost:8080for local). - Find your DAG: Click on the DAG containing the task from the homepage list. In our example our dag name is batch_processing_dag
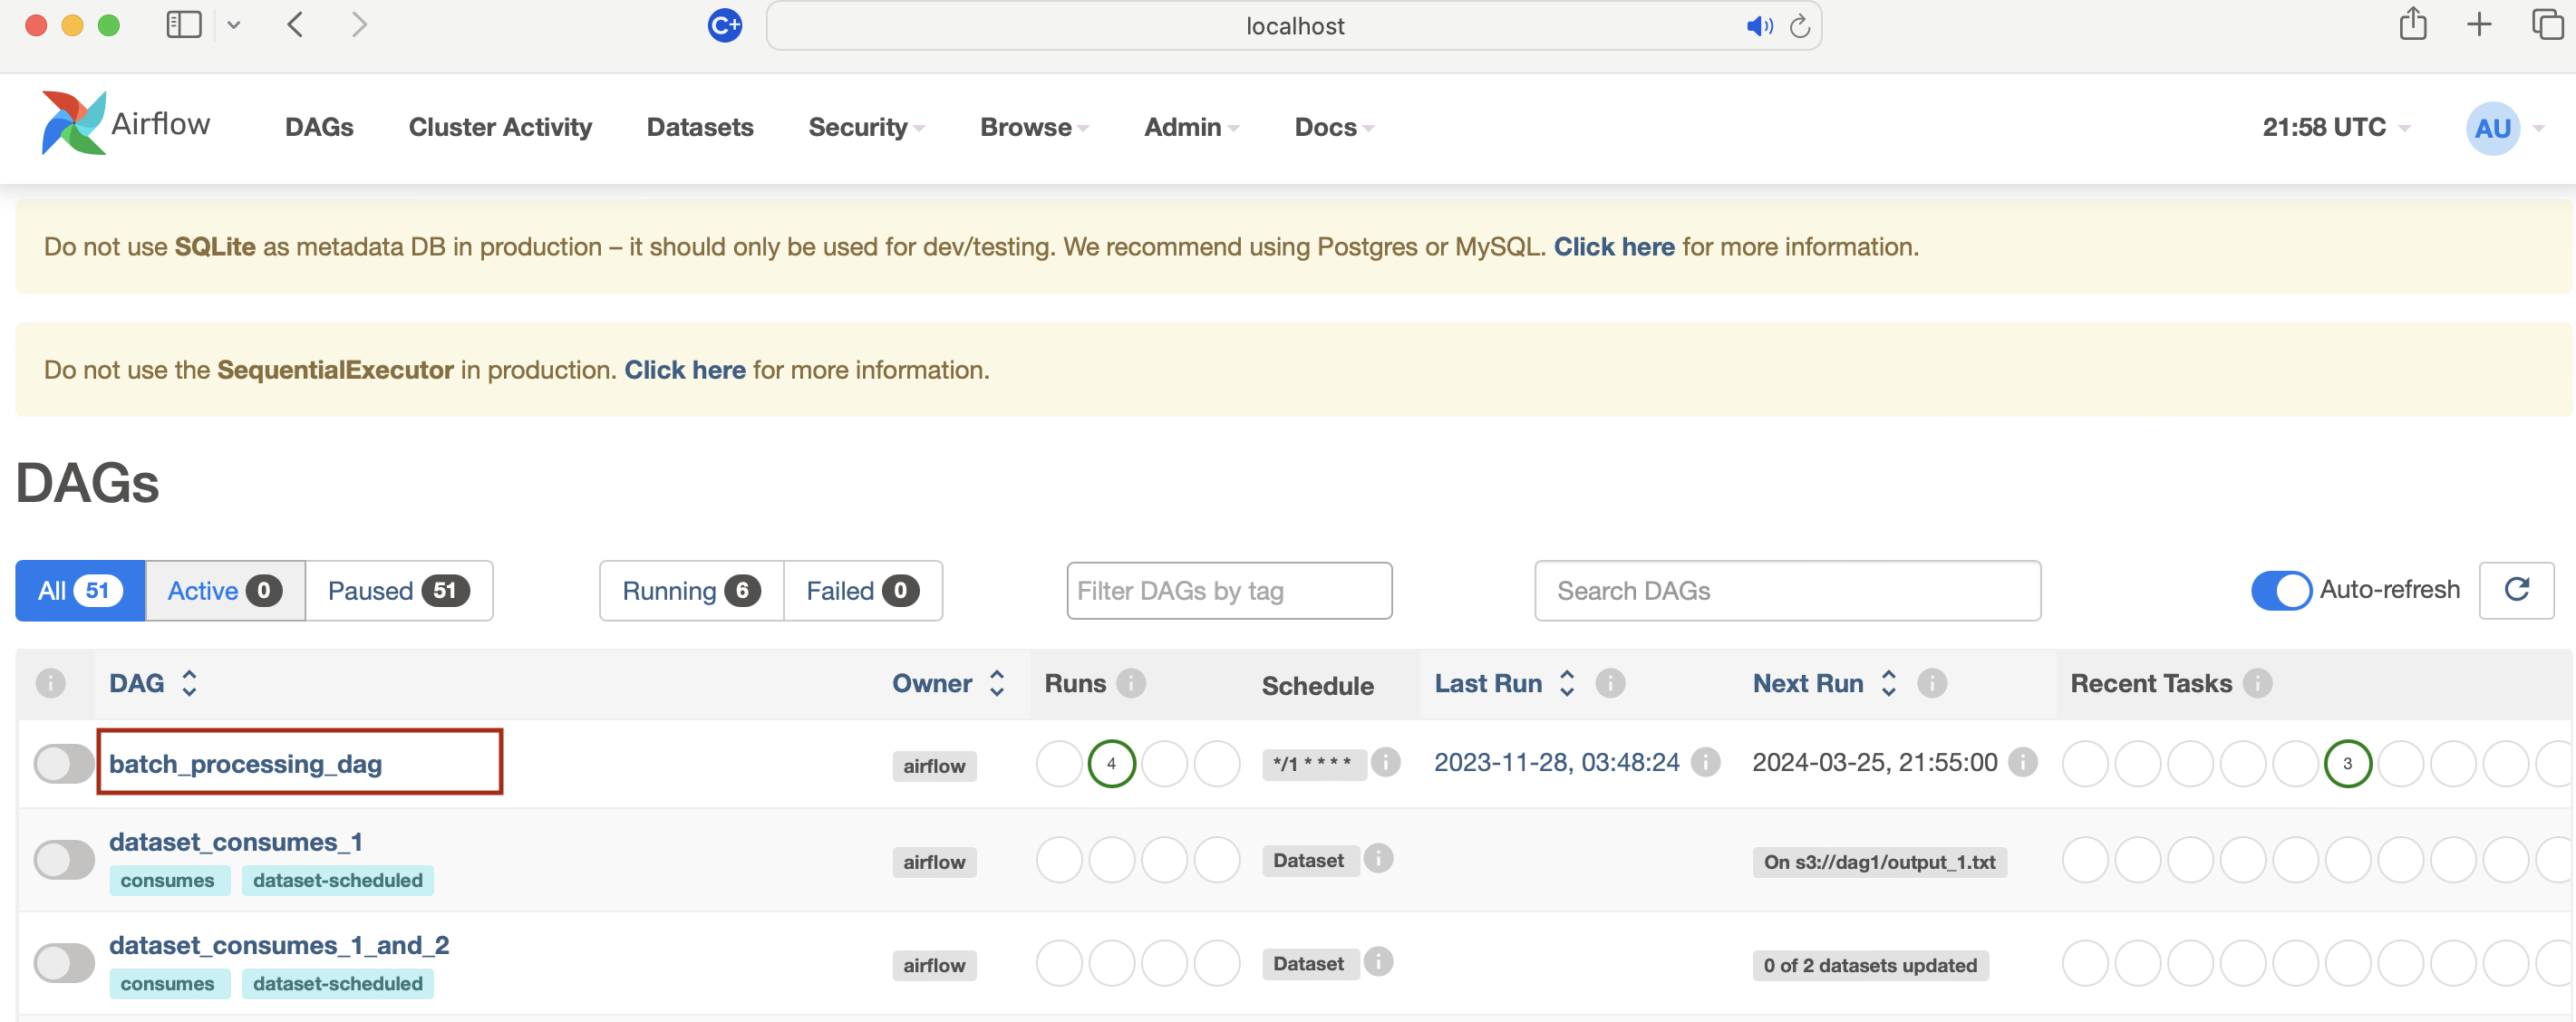
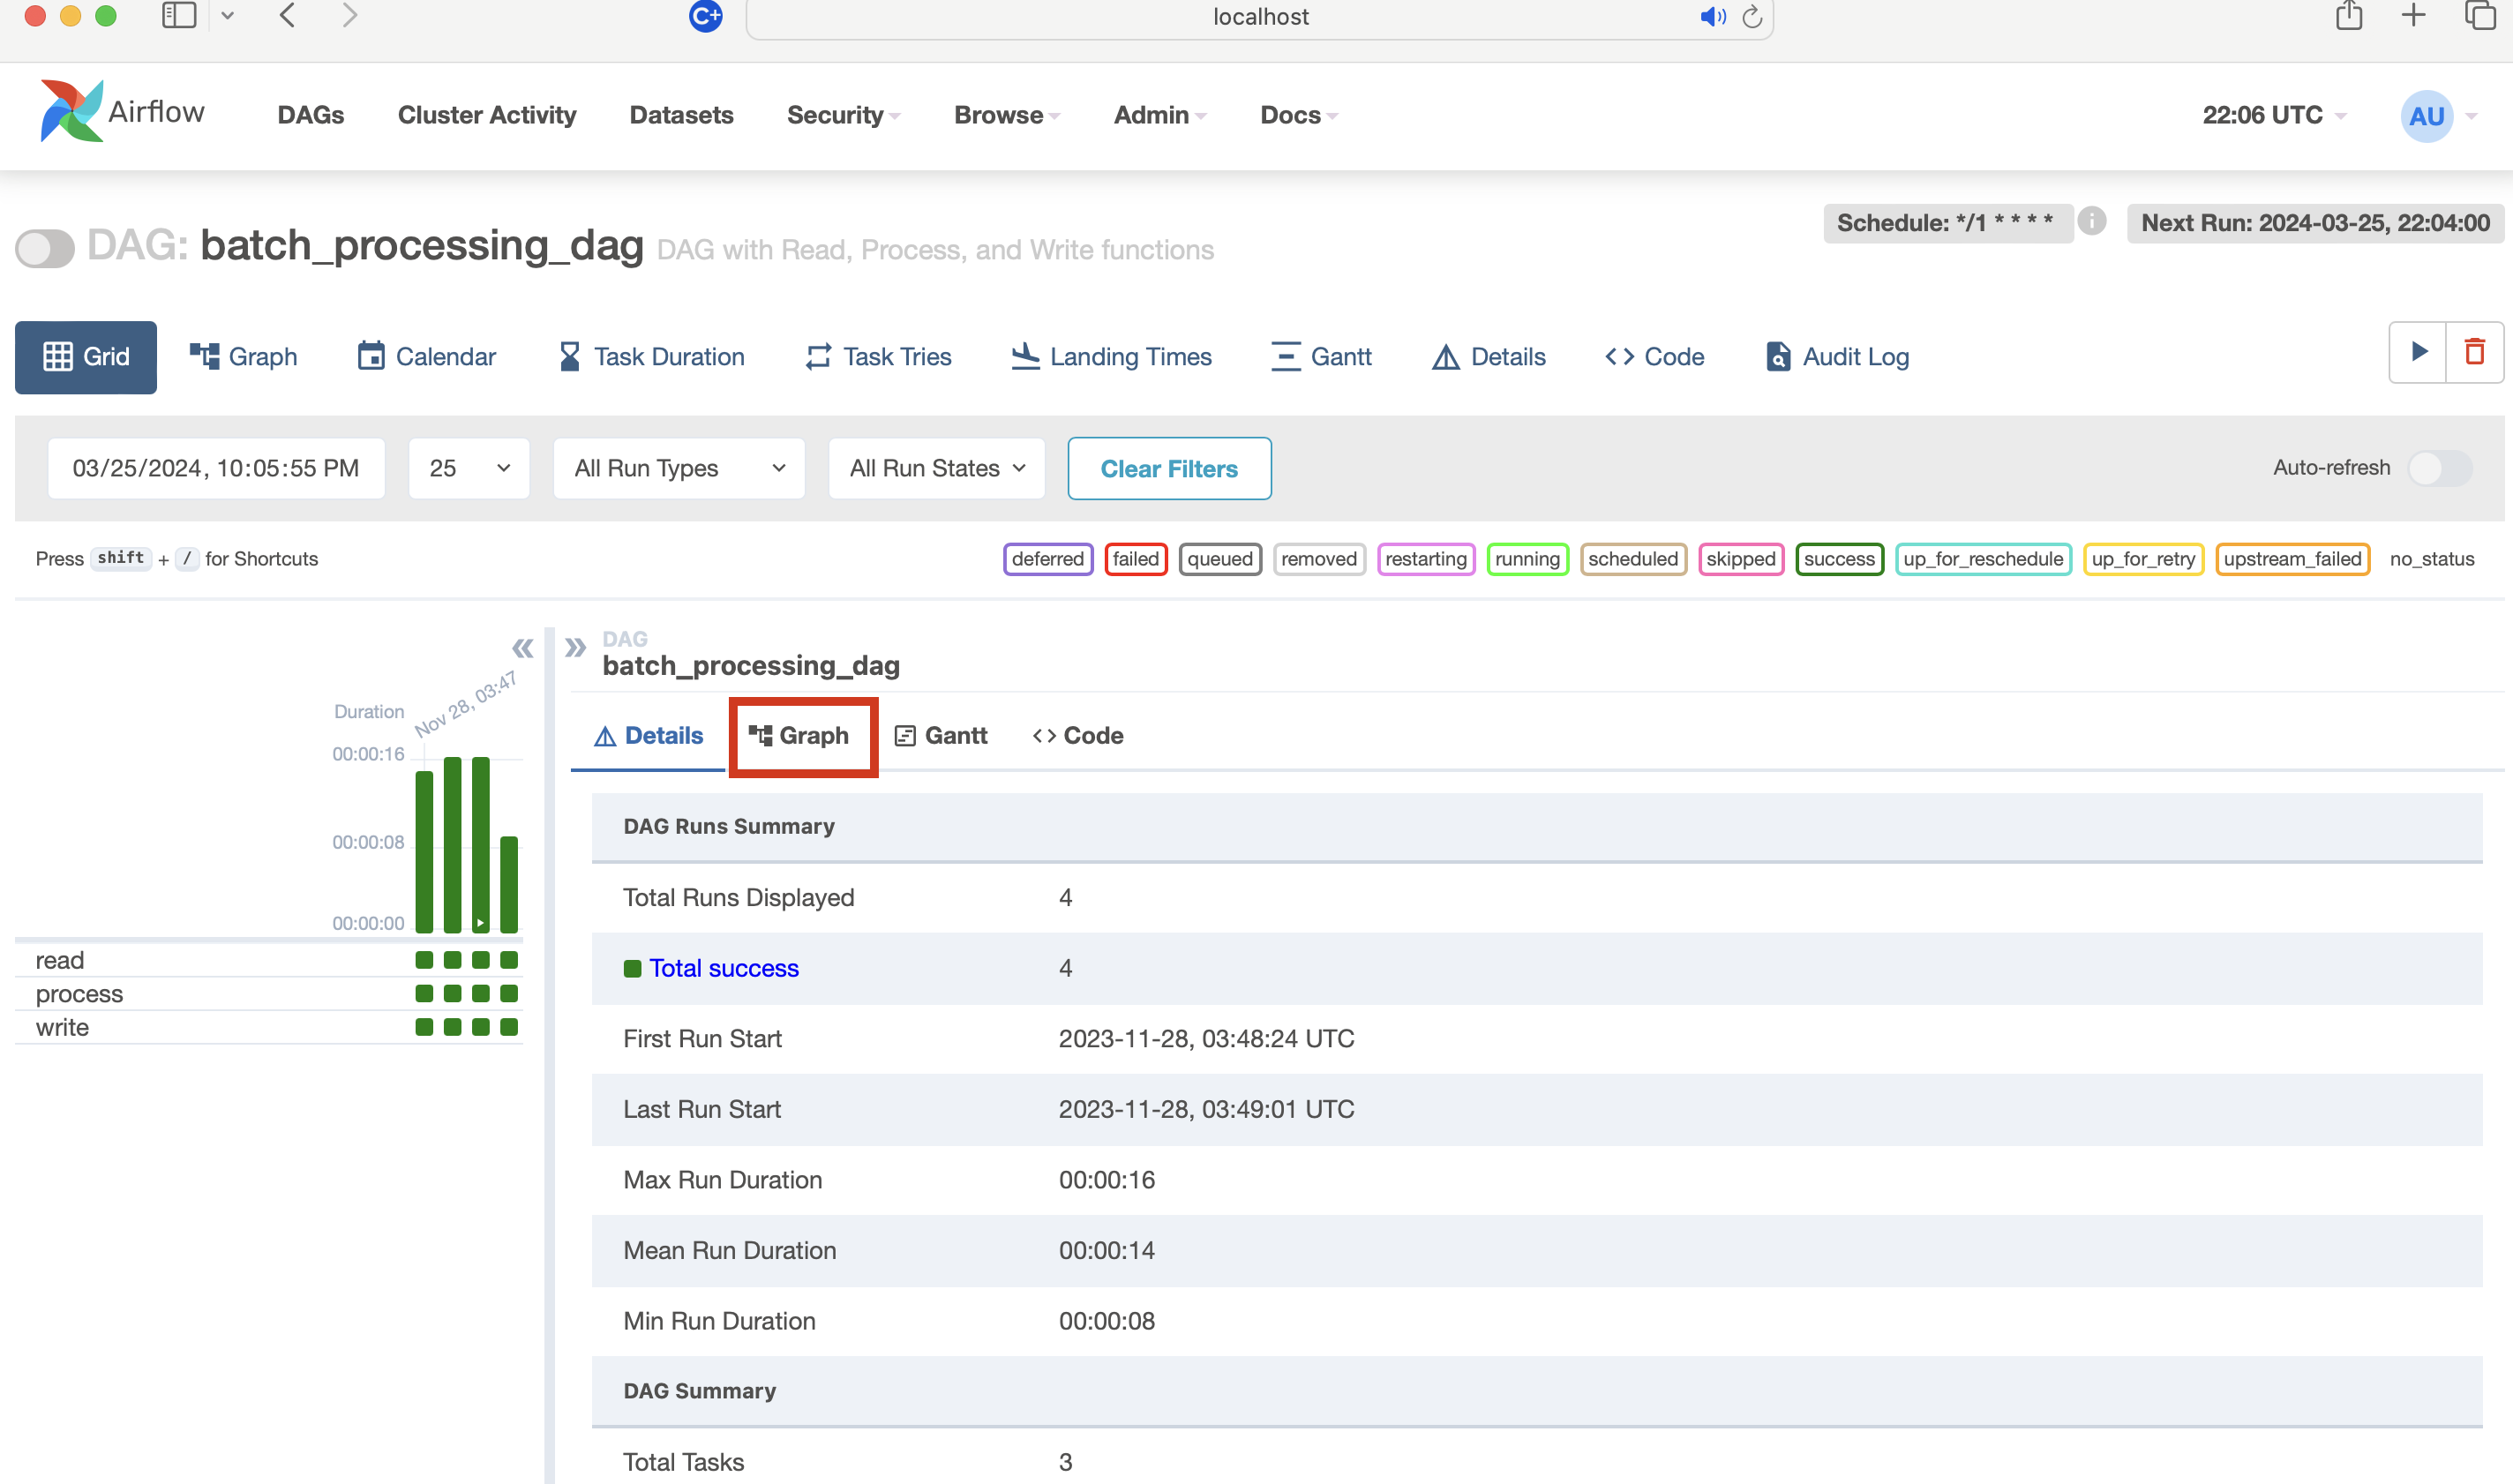
- Select the DAG run: Click on "Graph View," "Tree View," or "Task Instance" for the desired DAG run.
- Access task logs: Hover over the task in "Graph View" or "Tree View" and click the log file icon.
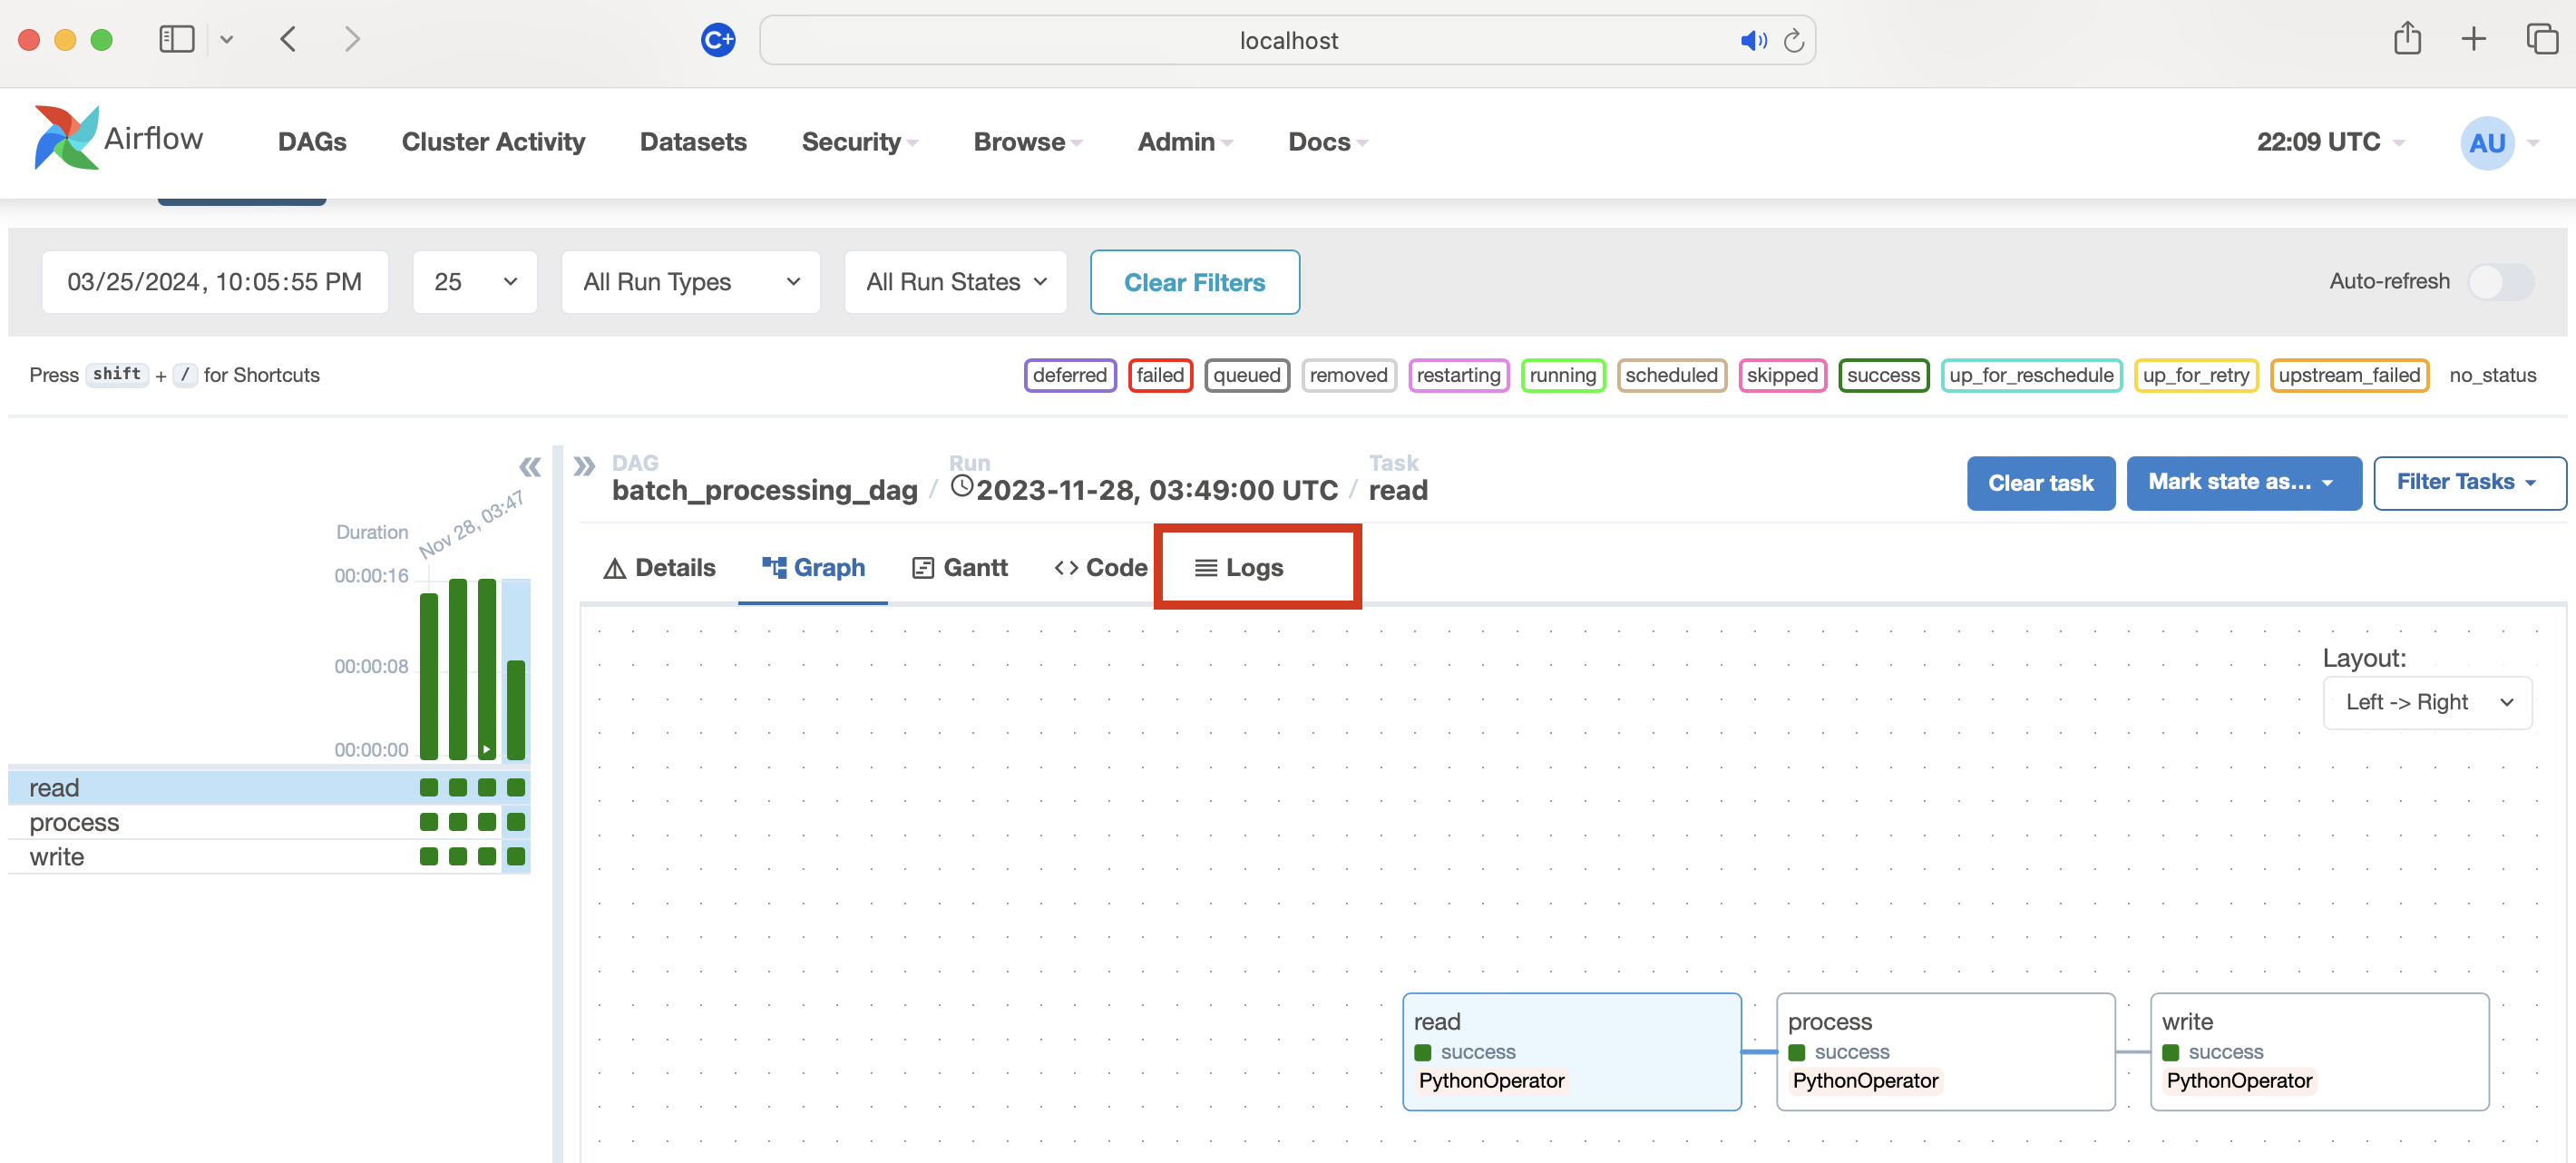
- Logs: Clicking/selecting on the task e.g. in this case read (pythonOperator) then clicking on the logs will show the logs window.
- Review logs: Examine the logs, and switch between attempts if necessary, to find execution details, errors, or messages.
2. Analyze Task Dependencies
In Airflow, tasks are often dependent on the successful completion of previous tasks. If a preceding task hasn't finished successfully, dependent tasks won't start. Review your DAG's structure in the Airflow UI to ensure that dependencies are correctly defined and that there are no circular dependencies causing a deadlock.
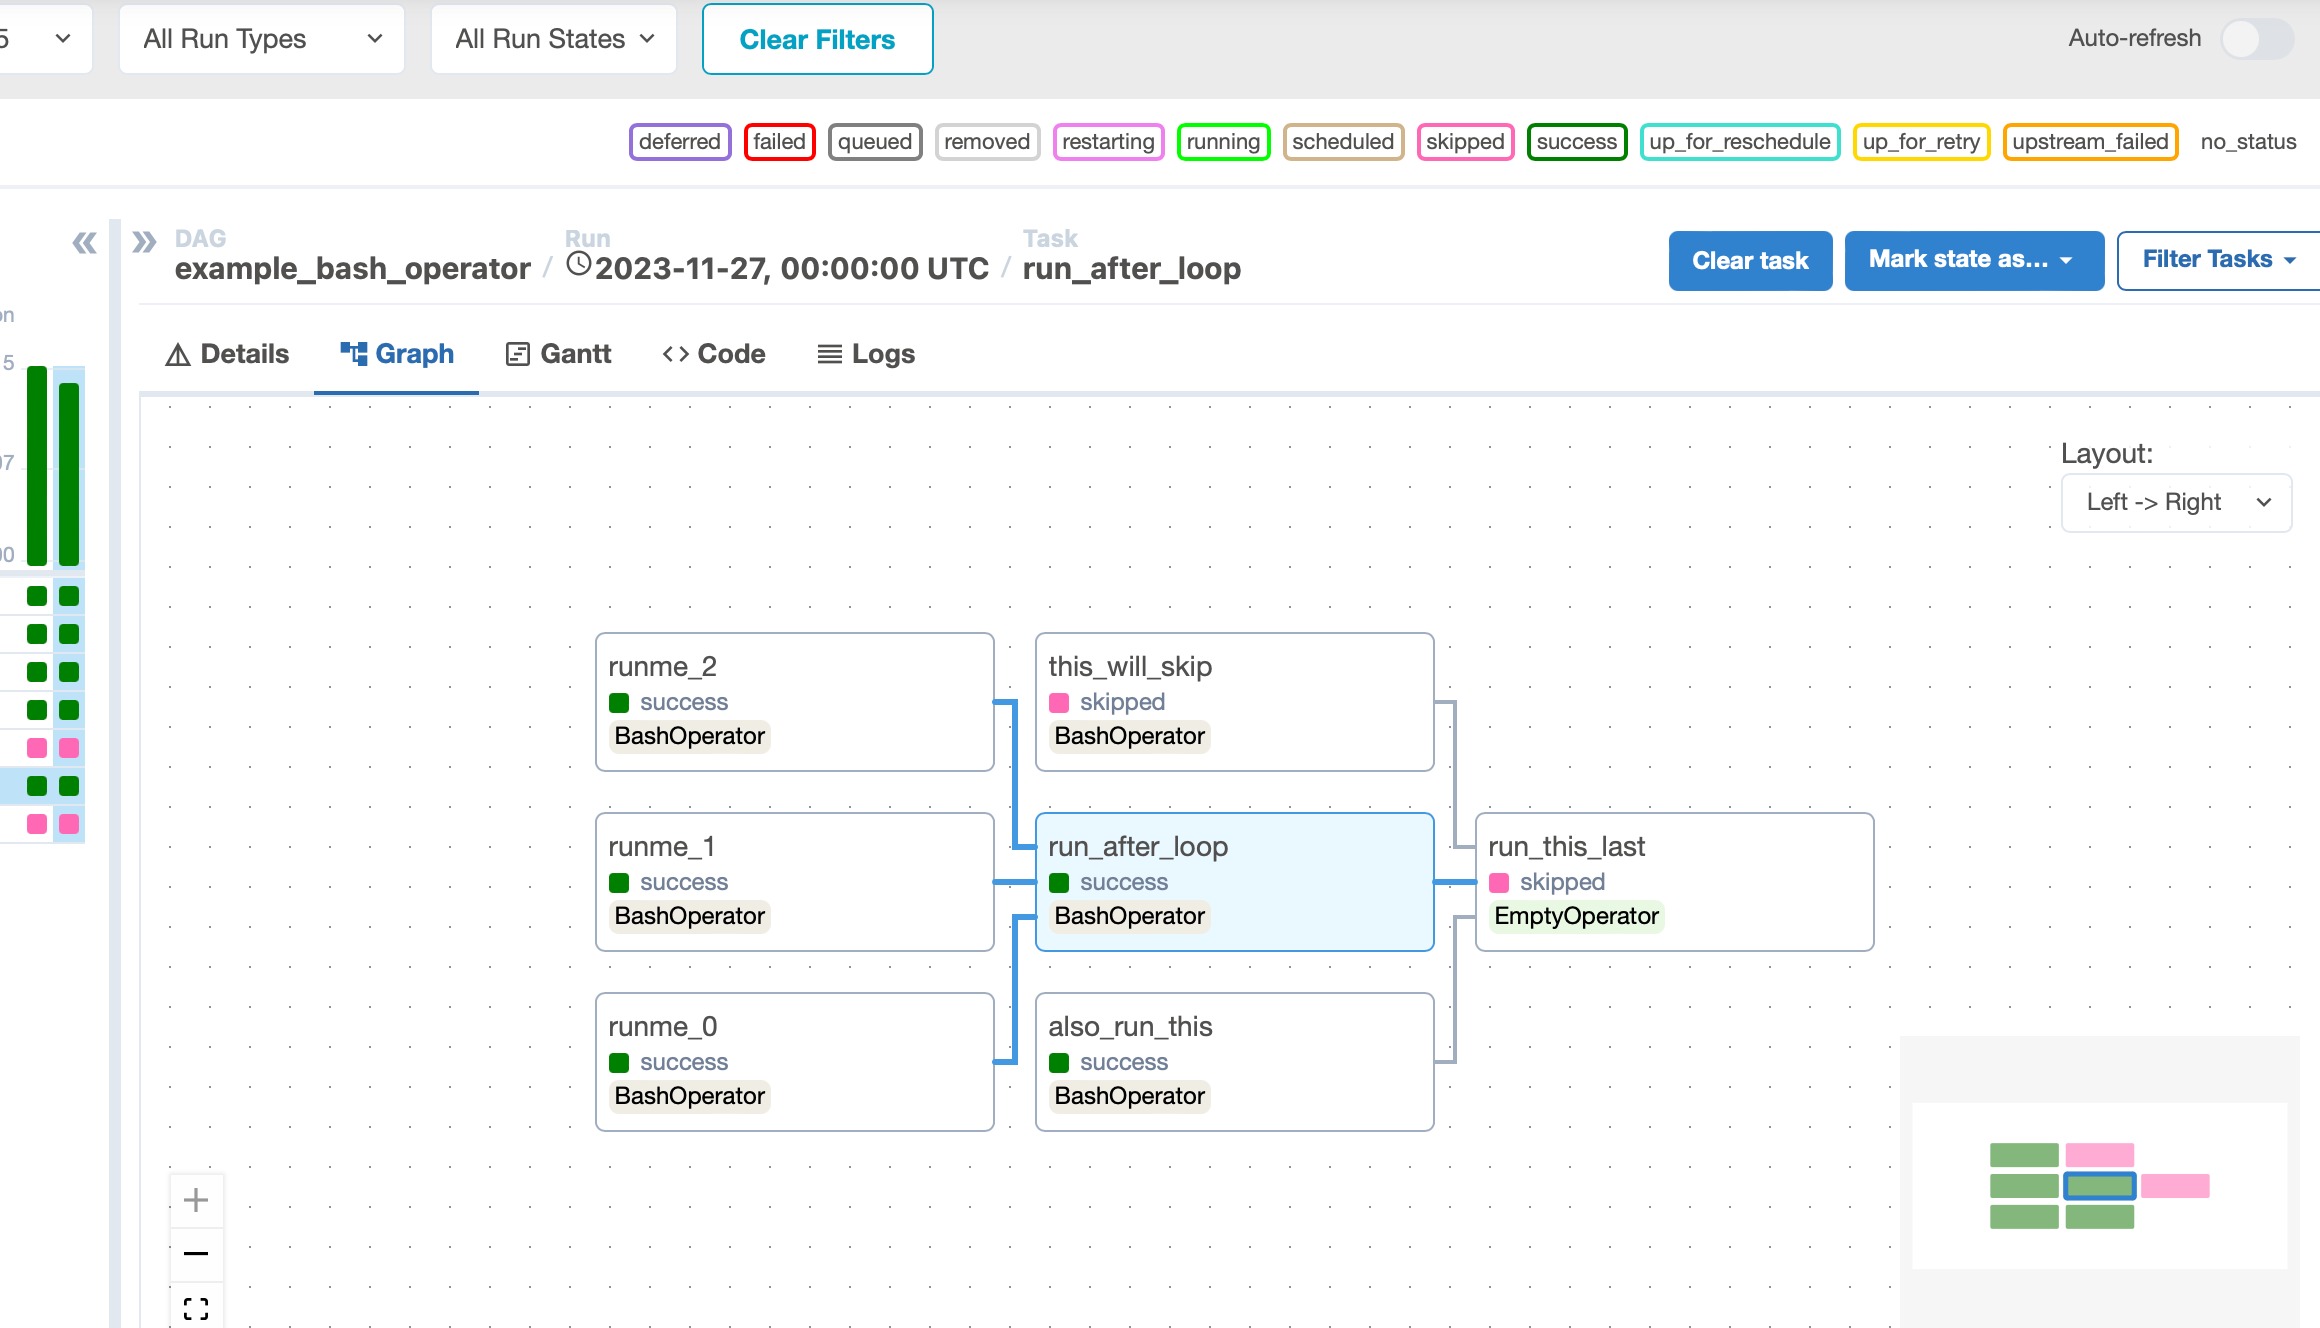
Examine task relationships: In the Graph View, tasks are represented as nodes, and dependencies (relationships) between them are depicted as arrows. This visualization helps you see how tasks are interconnected.
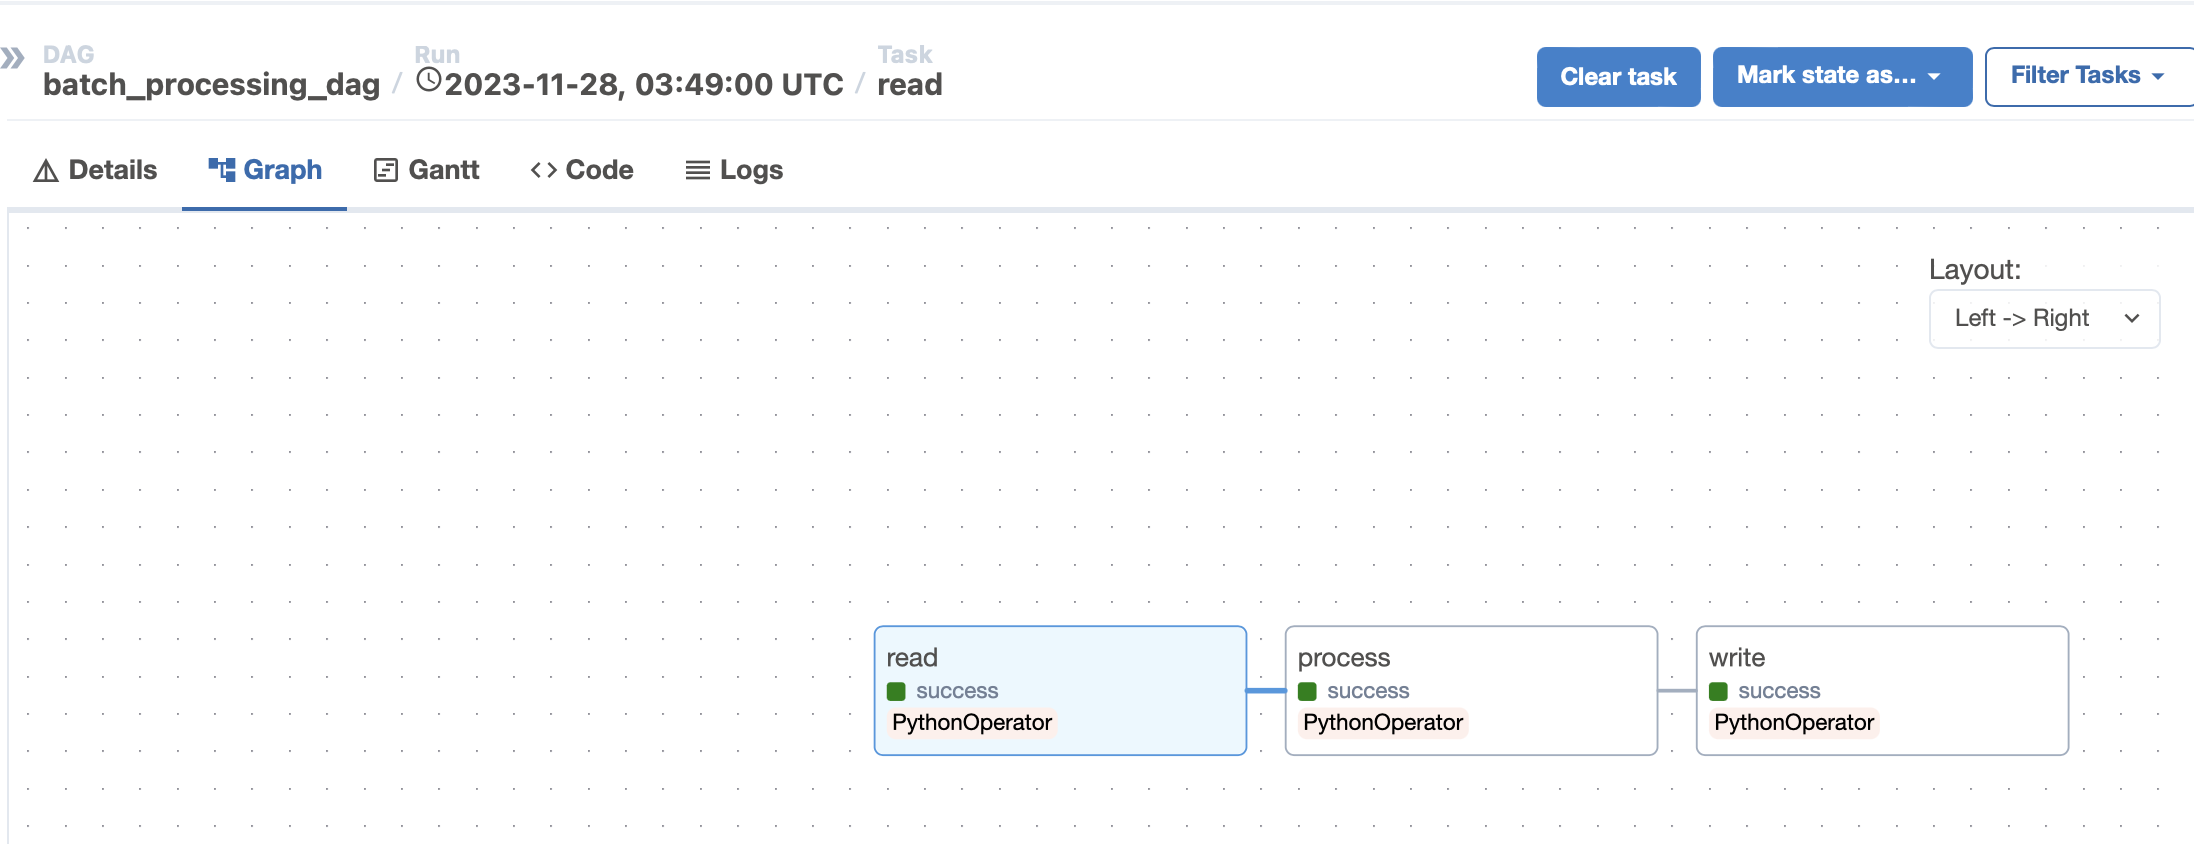
In our example, there are three stages where write is dependent on process and process is dependent on read. Similarly, in the sample below, the task dependency would look like this:
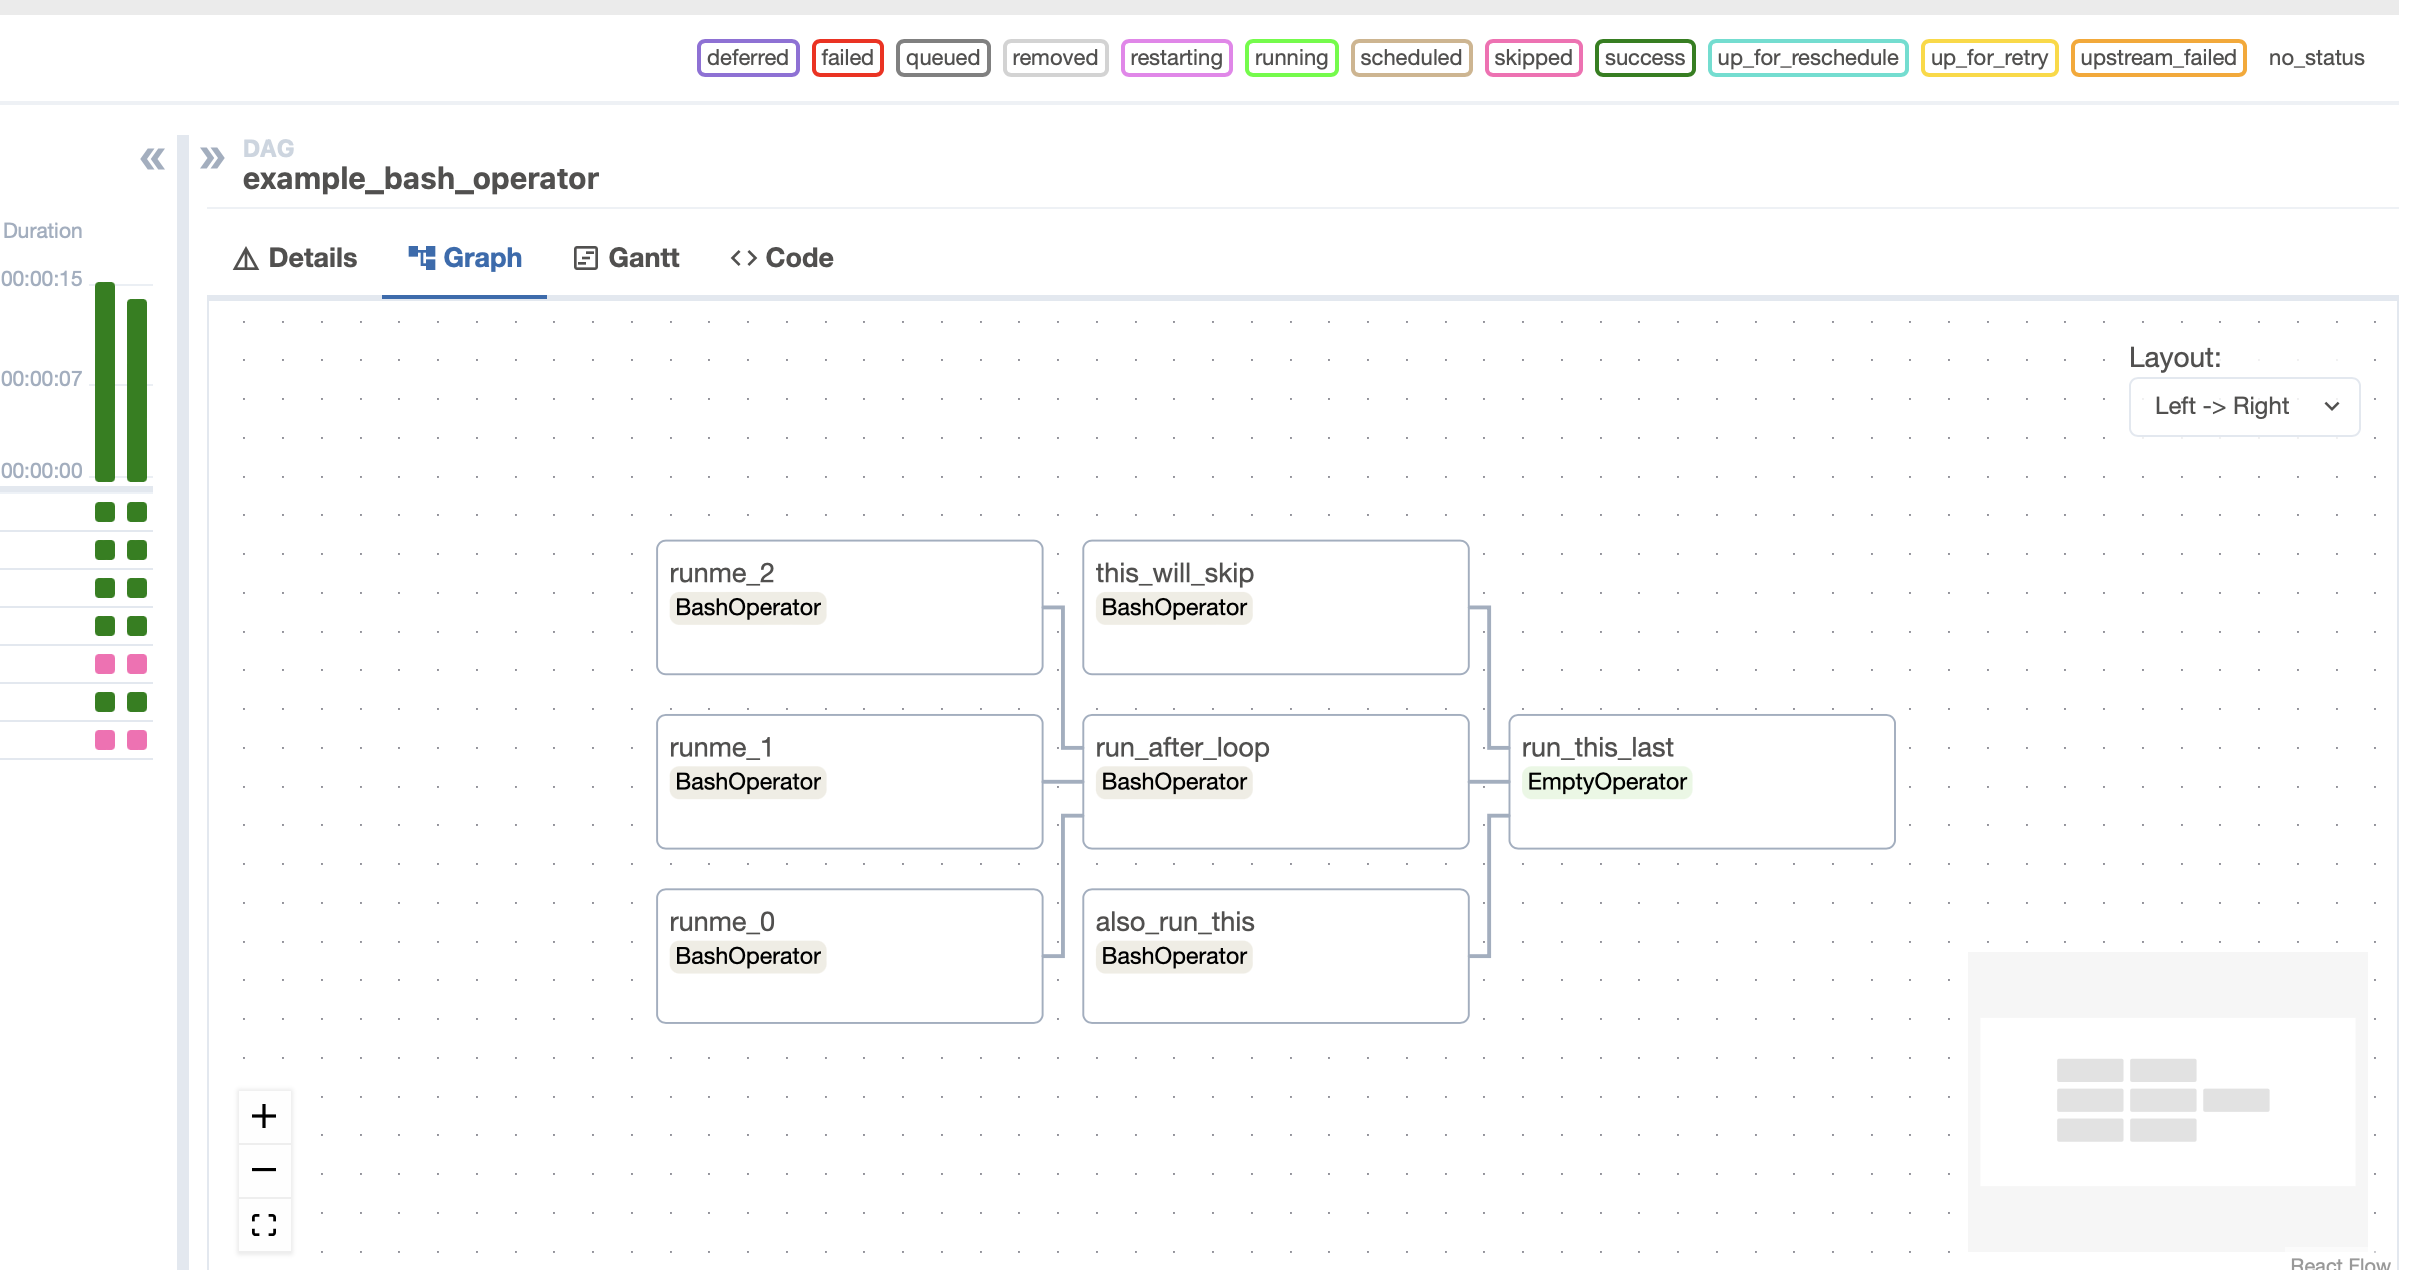
So here we have to verify and make sure that there is no circular dependency or deadlock.
Hover over tasks: Hovering over a task node will highlight its dependencies, showing both upstream (tasks that must be completed before this task) and downstream (tasks that depend on this task's completion). By selecting or clicking on a task it would show all the highlighted dependencies etc.
![hover over tasks]()
3. Resource Constraints
Tasks can become stuck if there are insufficient resources, such as CPU or memory, to execute the task. This is especially common in environments with multiple concurrent workflows. Monitor your system's resource usage to identify bottlenecks and adjust your Airflow worker or DAG configurations accordingly.
Monitor Task Duration and Queuing
- Access the Airflow Web UI: Navigate to your Airflow web UI in a web browser.
- View DAGs: Click on the DAG of interest to open its dashboard.
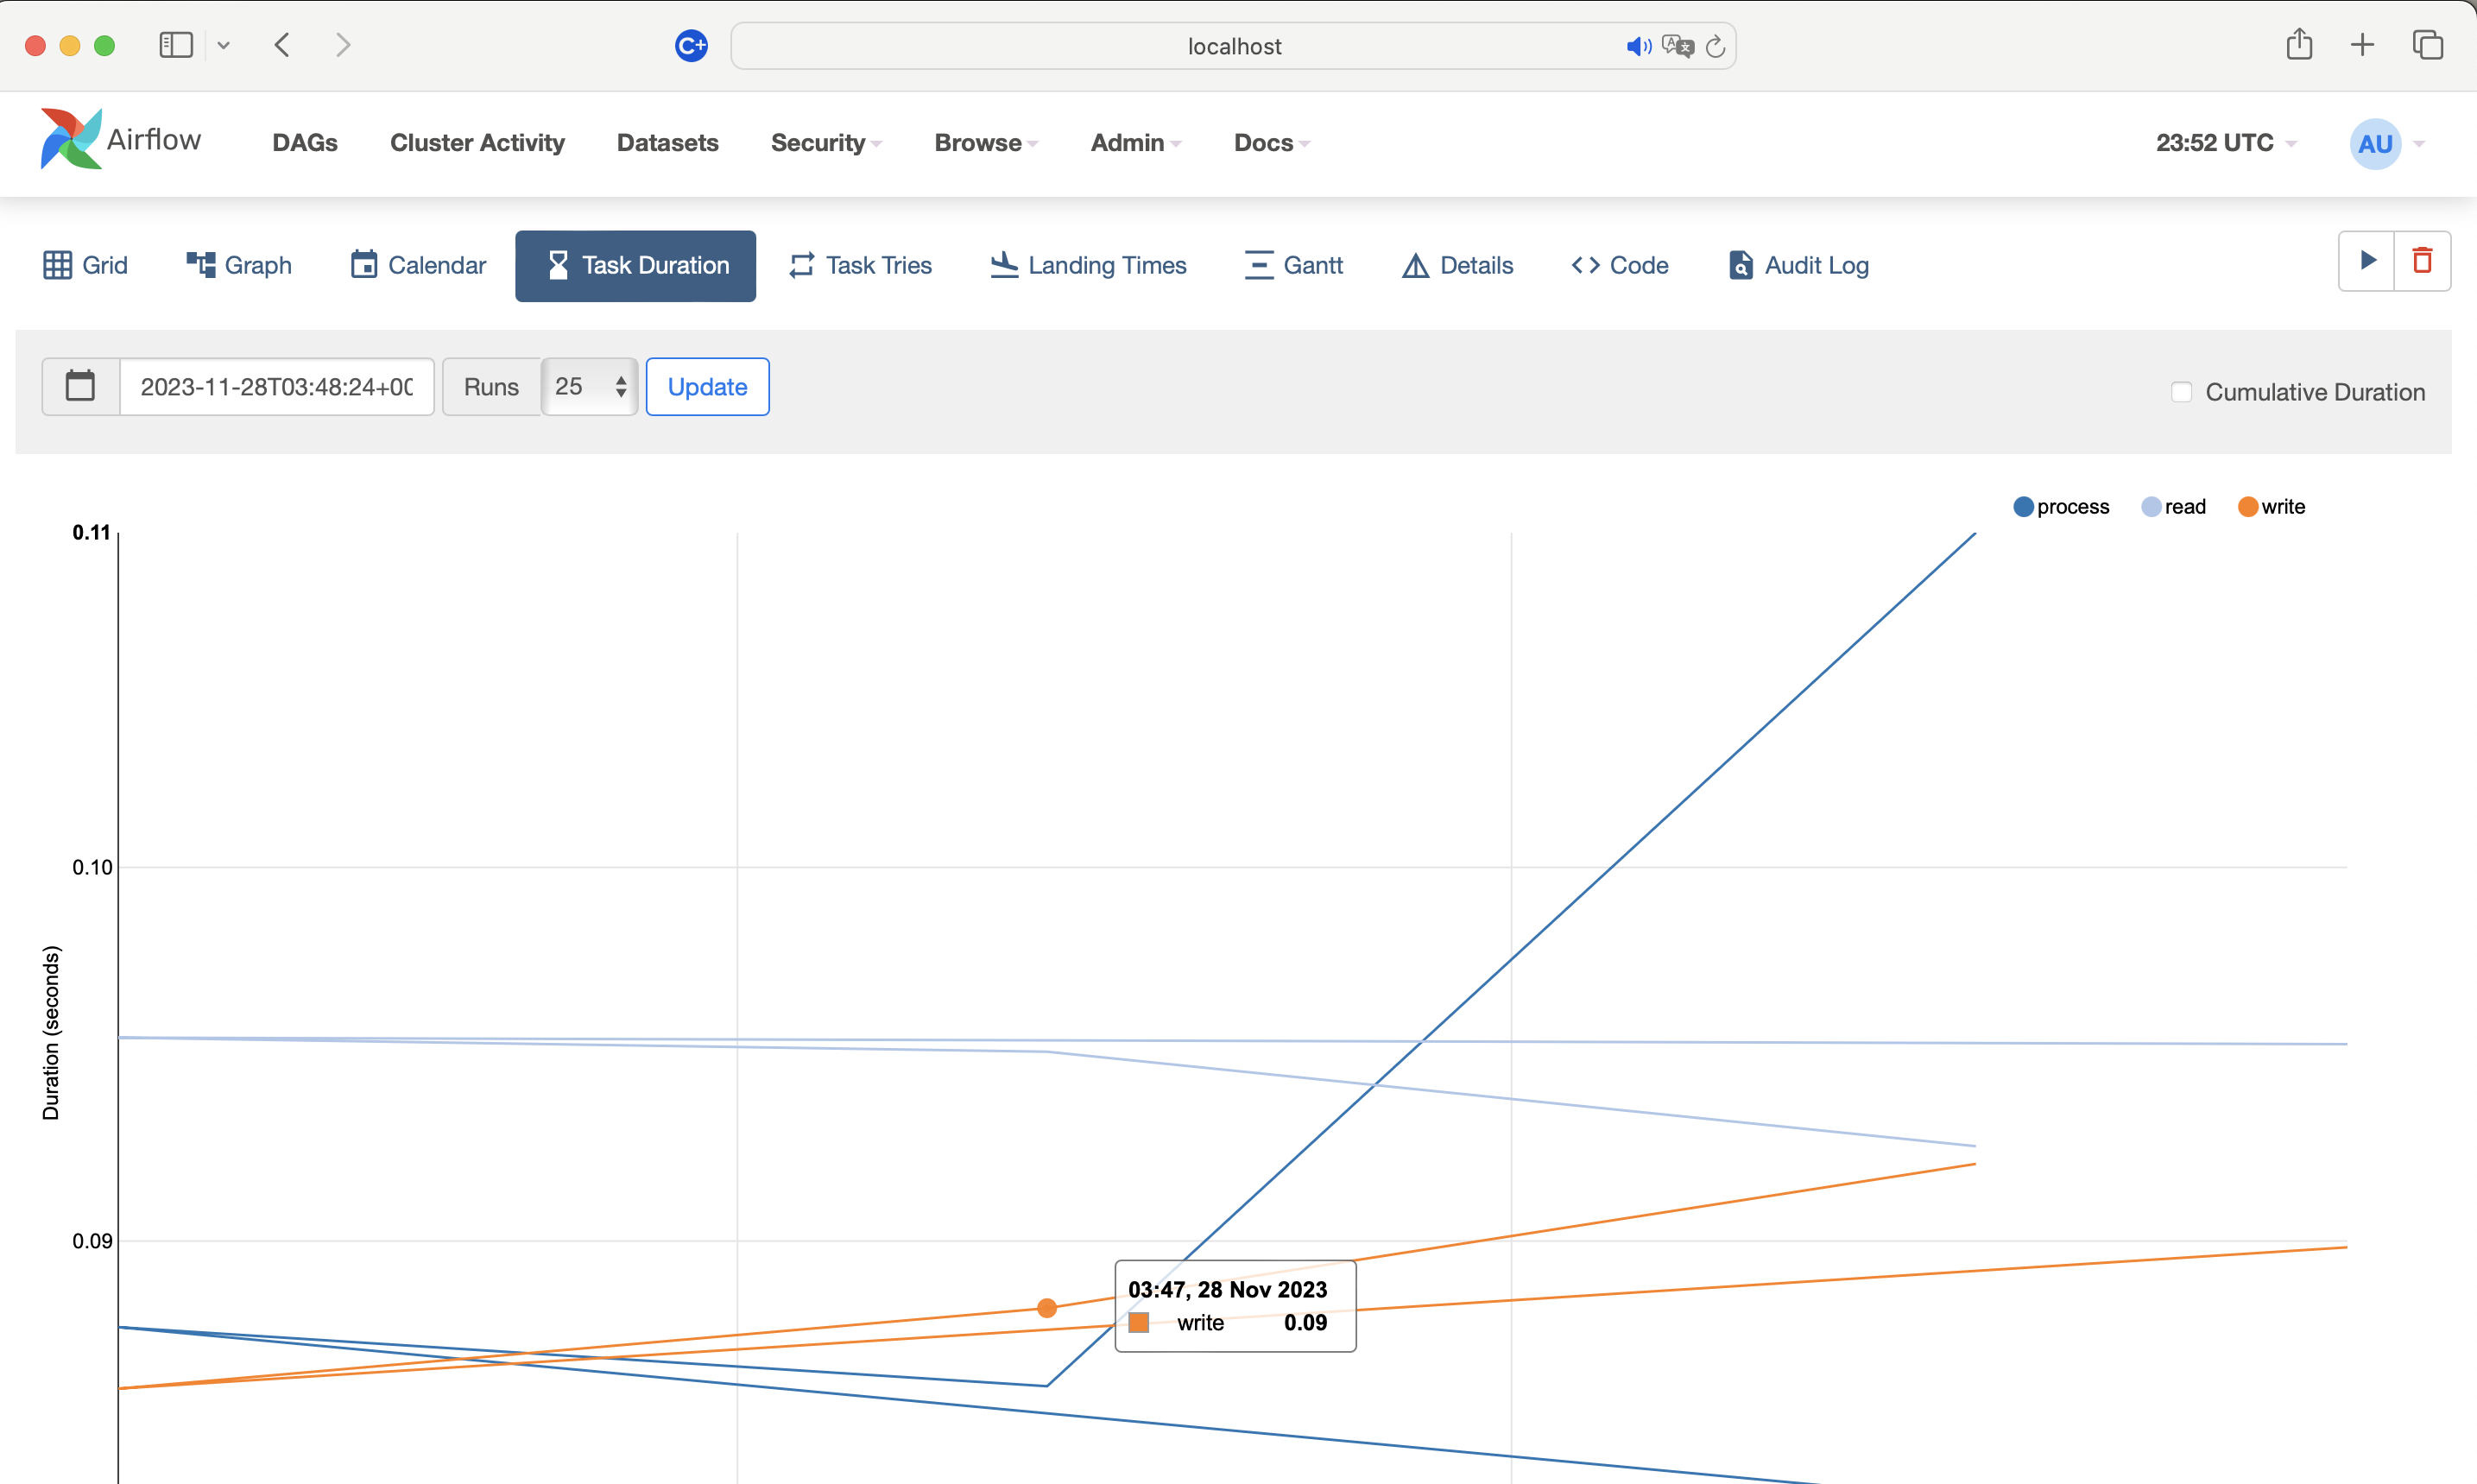
- Task duration: Go to the "Task Duration" tab to view the execution time of tasks over time. A sudden increase in task duration might indicate resource constraints.
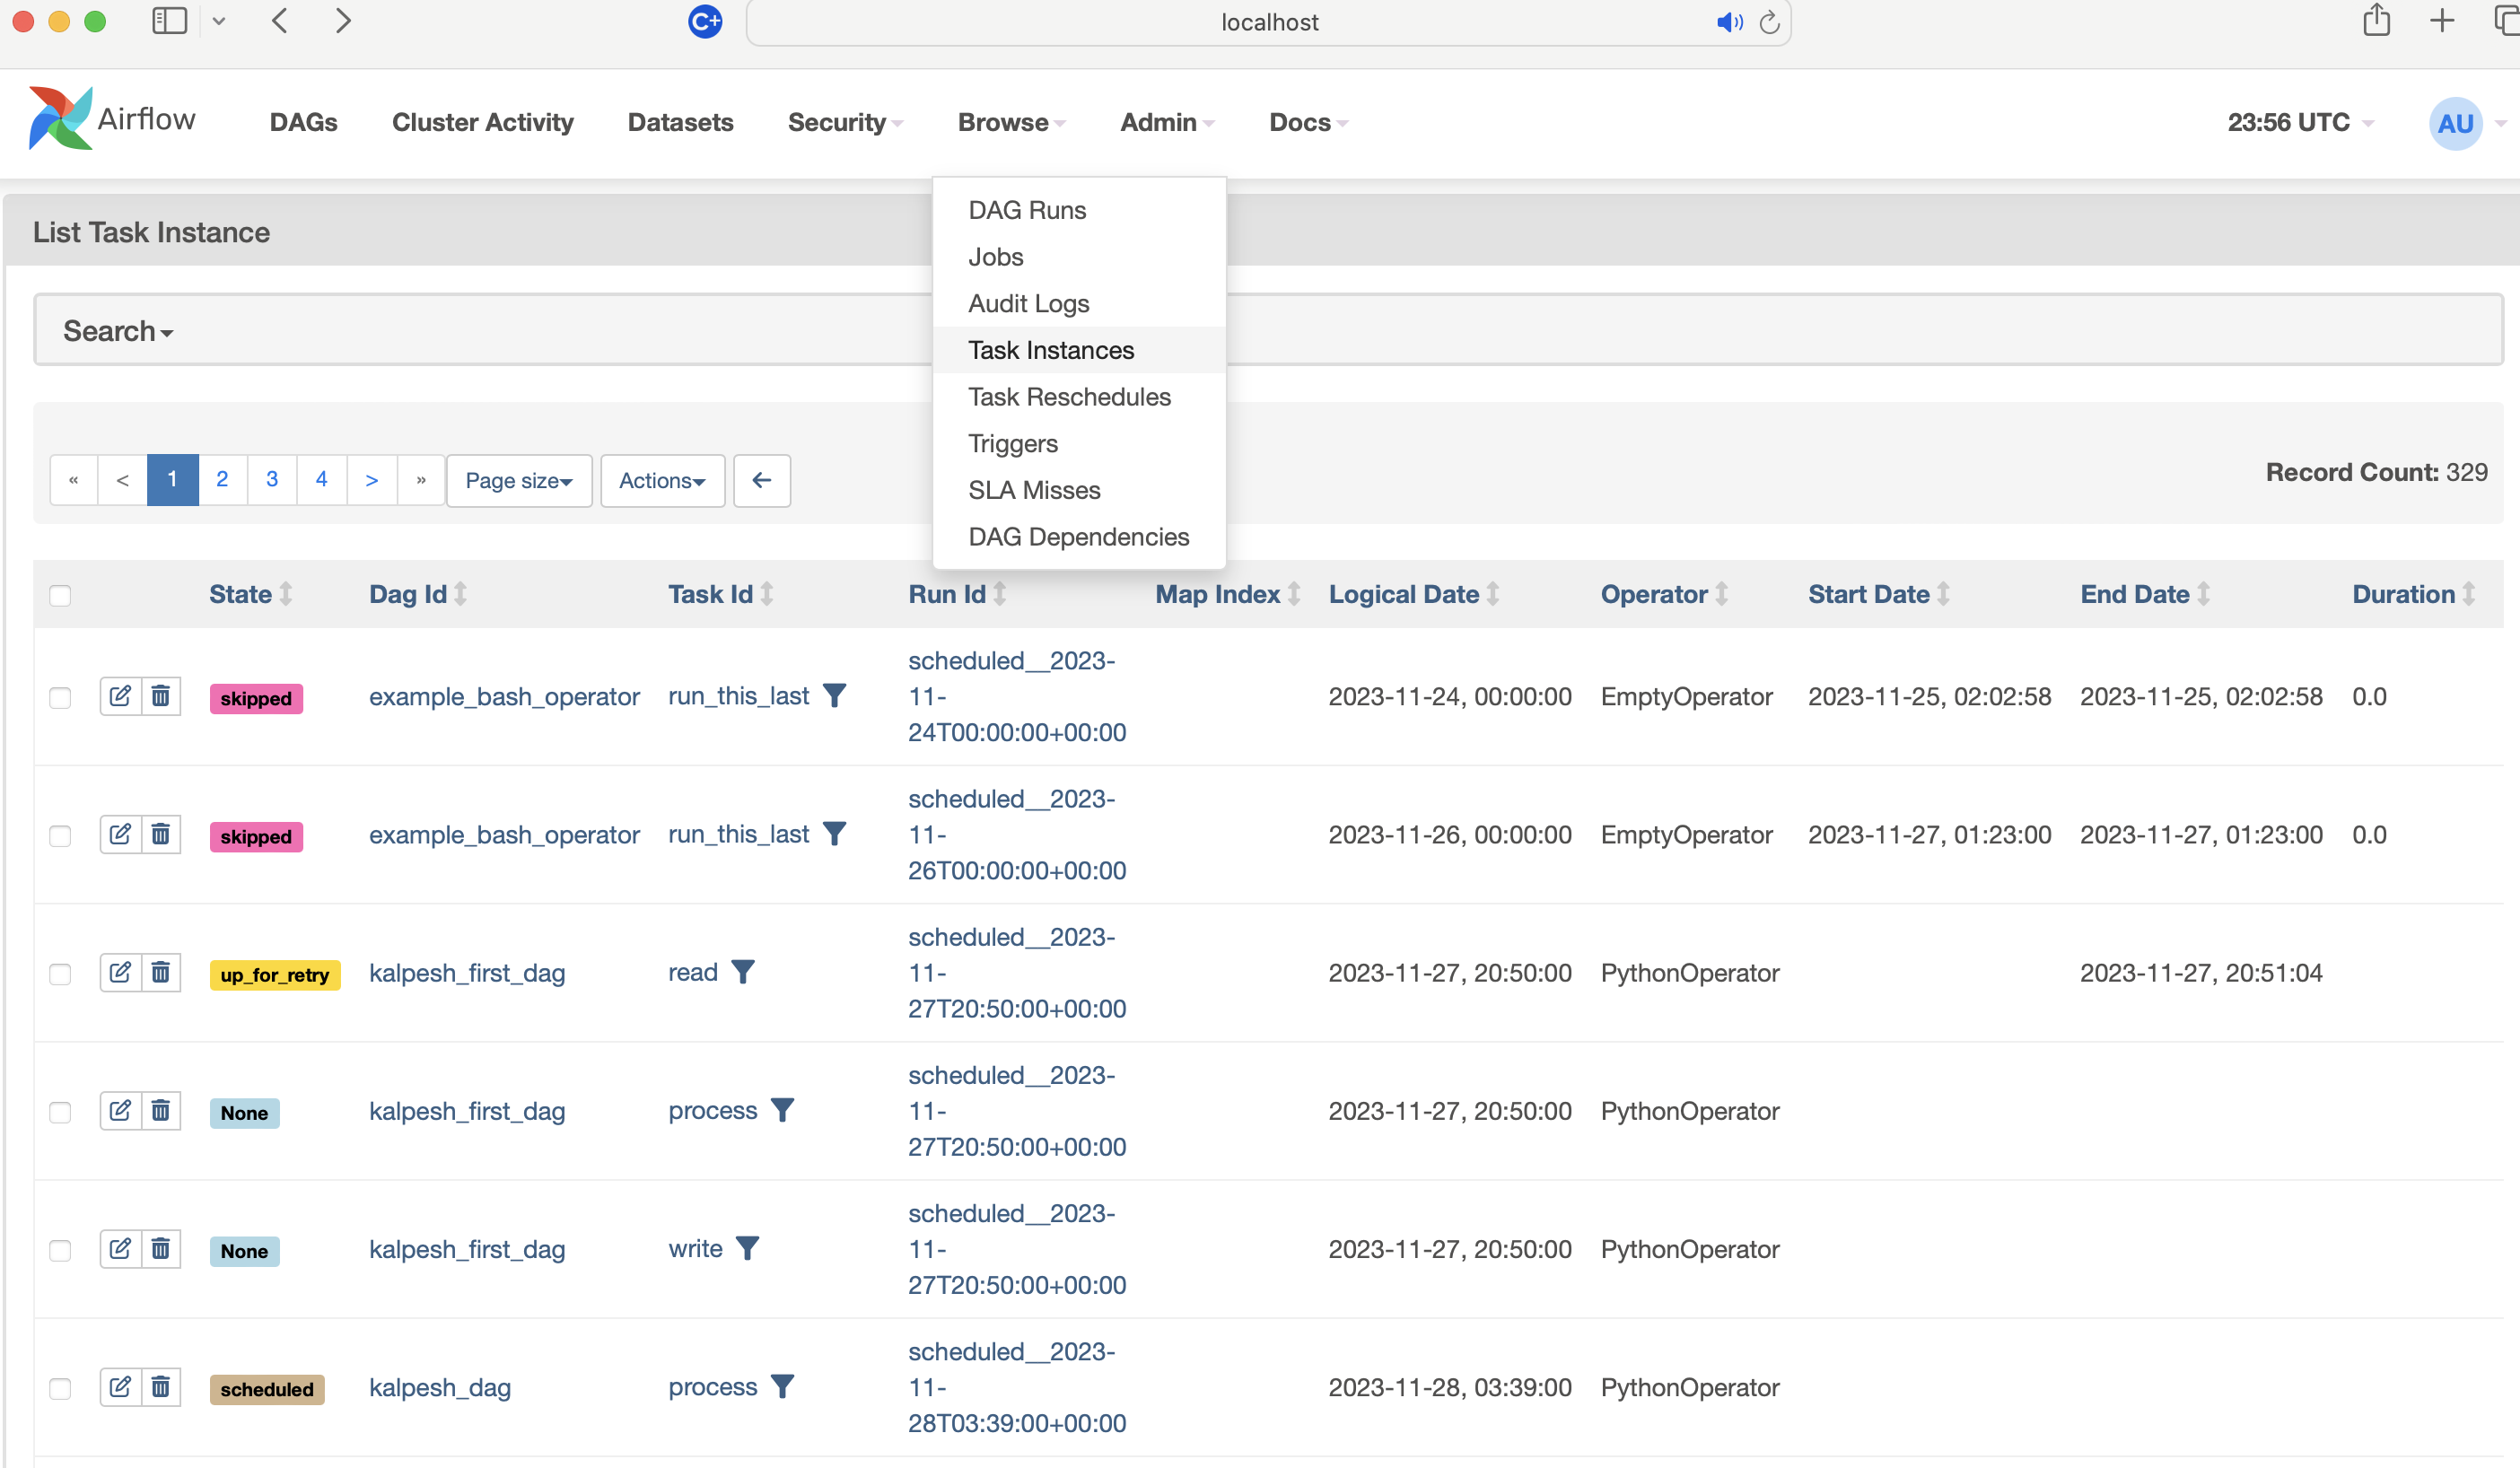
- Task instance details: Check the "Task Instance" page for tasks that have longer than expected execution times or are frequently retrying. This could suggest that tasks are struggling with resources.
4. Increase Logging Verbosity
For more complex issues, increasing the logging level can provide additional details. Adjust the logging level in the airflow.cfg file to DEBUG or INFO to capture more detailed logs that could reveal why a task is stuck.
5. Using Audit Log
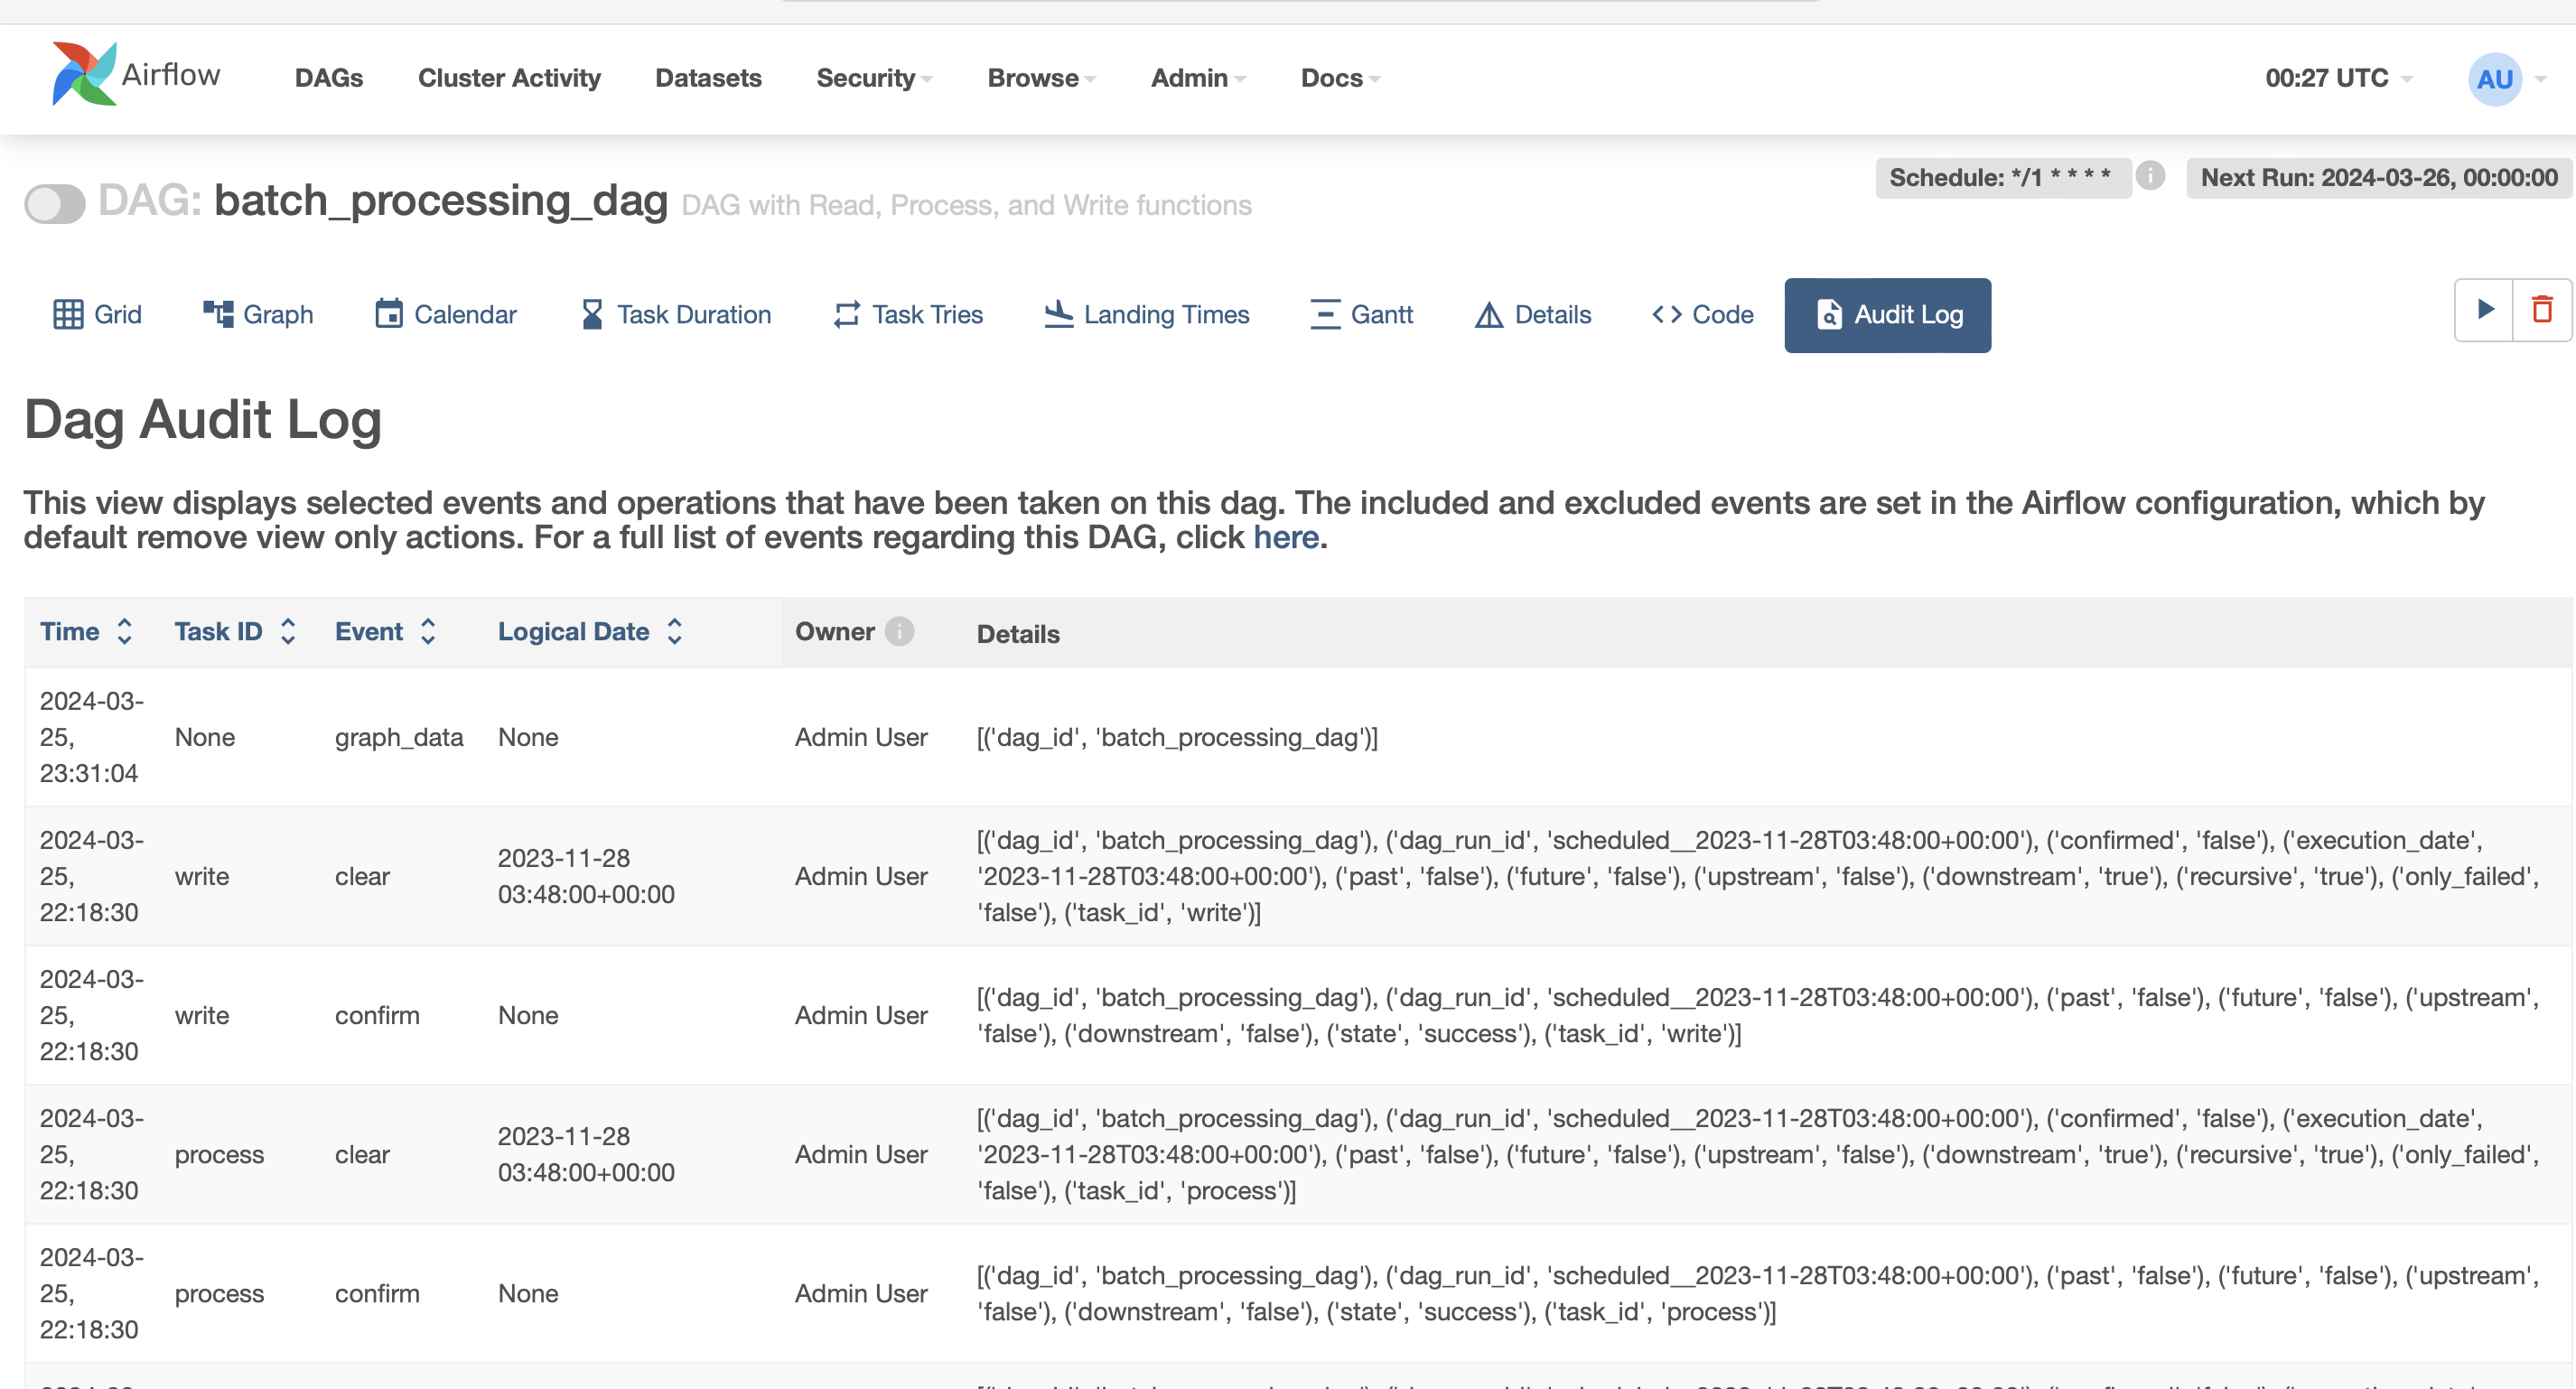
Audit logs play a crucial role in debugging workflows in Apache Airflow, particularly for tracking changes and user activities that could affect task execution. Here’s how audit logs can be leveraged to debug issues:
- Track configuration changes: Audit logs can help identify when and by whom specific DAG configurations were altered, which might lead to tasks getting stuck.
- Monitor trigger events: They provide insights into manual or automated trigger events that could unexpectedly initiate DAG runs, helping to debug unexpected task executions.
- Diagnose permission and access issues: By reviewing audit logs, you can spot changes in permissions or roles that may prevent tasks from accessing necessary resources or executing properly.
- Understand system changes: Any changes to the Airflow environment, such as updates to the scheduler, executor configurations, or the metadata database, can be tracked through audit logs, offering clues to debugging complex issues.
- Recover from operational mistakes: Audit logs offer a historical record of actions taken, assisting in reversing unwanted changes or actions that could have led to task failures or system malfunctions.
- Security and compliance insights: For tasks that involve sensitive data, audit logs can ensure that all access and modifications are authorized and compliant, aiding in debugging security-related issues.
![dag audit log]()
Conclusion
In conclusion, debugging in Apache Airflow is an essential skill for maintaining robust and reliable data workflows. By understanding Airflow's architecture and knowing how to effectively troubleshoot common issues such as stuck tasks, developers and data engineers can ensure their workflows are optimized for both performance and efficiency. The strategies outlined, from checking logs and analyzing task dependencies to identifying resource constraints and adjusting logging verbosity, provide a comprehensive approach to diagnosing and resolving issues within Airflow environments. Additionally, the utilization of audit logs serves as a powerful tool in this debugging arsenal
Opinions expressed by DZone contributors are their own.

Comments