Enabling High-Quality Code in .NET
In this article, let's talk about what high-quality code is, and how we can ensure it by using different tools.
Join the DZone community and get the full member experience.
Join For FreeIntroduction to Code Quality
When we talk about code quality, we can think of different aspects of it. We mainly refer to the attributes and characteristics of code. While there is no widely adopted definition of high-quality code, we know some of the characteristics of good code:
- It is clean.
- Absence of code smells
- Consistent
- Functional: it does what we say it does.
- Easy to understand
- Efficient
- Testable
- Easy to maintain
- Well documented
There are probably additional characteristics of good code, but these are the core of the high-quality code.
However, even though we know some attributes and characteristics of high-quality code, they can mean a different thing to different people, or they can have a different view on priorities against them. To have a similar view to the same topic of high-quality code, we need to impose some standards and guides.
Coding Standards
Coding standards and code styles provide uniformity in code inside a project or a team. By using them, we can easier use and maintain our code. Style guides are company standard conventions, usually defined per programming language, as best practices that should be enforced. This ensures consistent code across all team members.
There are different examples of code standards; for example, by a company like Microsoft or per language such as C#. These standards usually define the following:
- Layout conventions
- Commenting conventions
- Language guidelines
- Security
Code Reviews
Code reviews are a helpful tool for teams to improve code quality. It enables us to reduce development costs, by catching issues in the code earlier, but also as a communication and knowledge sharing tool. Code review in particular means an approach of reviewing other programming code for mistakes and other code metrics, but also if all requirements are implemented correctly.
Code review usually starts with a submitted Pull Request (PR) for code to be added to a codebase. Then, one of the team members needs to review the code.
It is important to do code reviews to improve coding skills, but also it represents a great knowledge-sharing tool in a team. In a typical code review, we should check for:
- Code readability
- Coding style
- Code extensibility
- Feature correctness
- Naming
- Code duplication
- Test coverage
- Other aspects
Code reviews can be implemented in different ways, from single-person reviews to pair programming (much better). However, these methods are usually time-intensive, so code quality check tools can automate that process.
Some benefits of code reviews are as follows:
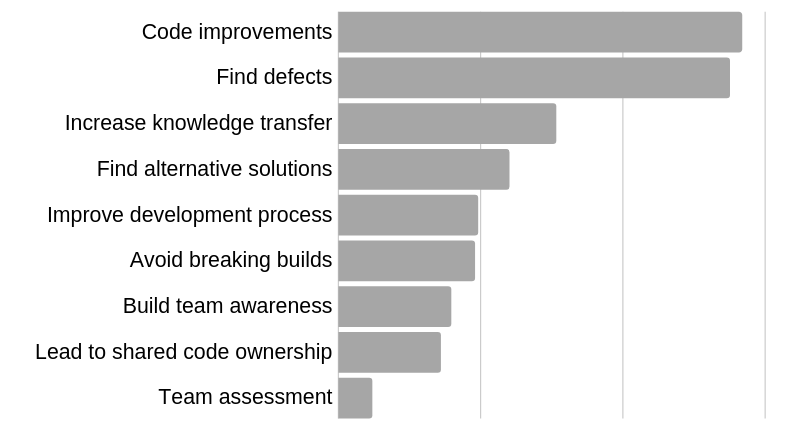
Tools To Check for Code Quality
When we talk about checking for code quality in terms of tools, there are two options here: dynamic and static code analysis.
Dynamic code analysis is actually analyzing applications during execution, where we analyze code for reliability, quality, and security. This kind of analysis helps us to find issues related to application integration with database servers and other external services. The primary objective is to find issues and vulnerabilities in software that can be debugged.
Another kind of analysis is static code analysis. Here we analyze source code to identify different kinds of flaws. It doesn’t give us a holistic view of the application, so it’s recommended to use it together with dynamic code analysis. There are different tools for dynamic code analysis, such as Microsoft IntelliTest, Java Pathfinder, or KLEE for C/C++.
In this post, we are going to focus on static code analysis, as it can be automatized and produce results even without any input from the developer.
Static Code Analysis
Static code analysis is a way to check application source code even before the program is run. This is usually done by analyzing code with a given set of rules or coding standards. It addresses code vulnerabilities, code smells, test coverage, and other coding standards. Also, it includes common developer errors which are often found during PR reviews.
It is usually incorporated at any stage into the software development lifecycle after the “code development” phase and before running tests. It is usually the case that CI/CD pipelines include static analysis reports as a quality gate even before merging PRs to a master branch.
Along with CI/CD pipelines we can use static code analysis during development time, by using a different set of tools that can quickly understand what rules are being broken. This enables us to fix code earlier in the development lifecycle, and we can avoid builds that fail later.
During static code analysis, we check also for some code metrics, such as Halstead Complexity Measures or Cyclomatic Complexity, which counts the number of linearly independent paths within your source code. The hypothesis is that the higher the cyclomatic complexity, the more chance of errors. Modern use of cyclomatic complexity is to improve software testability.
.NET Code Analysis
In the .NET world, we have different code analyzers, such as recommended .NET Compiler Platform (Roslyn) Analyzers for inspecting C# or Visual Basic code for style, quality, maintainability, design, and other issues.
Analyzers can be divided into the following groups:
- Code style analyzers are built into Visual Studio. The analyzer’s diagnostic ID or code format is IDExxxx, for example, IDE0067.
- Code quality analyzers are now included with the .NET 5 SDK and enabled by default.
- External analyzers, such as:
Each analyzer has one of the following severity levels: Error, Warning, Info, Hidden, None, and Default.
If rule violations are found by an analyzer, they’re reported in the code editor as a squiggle under the offending code and the Error List window (as shown in the image below). The analyzer violations reported in the error list match the severity level setting of the rule. Many analyzer rules, or diagnostics, have one or more associated code fixes that you can apply to correct the rule violation.

To enforce the rules at build time, which includes through the command line or as part of continuous integration (CI) build, choose one of the following options:
Create a .NET 5.0 or later project which includes analyzers by default in the .NET SDK. Code analysis is enabled, by default, for projects that target .NET 5.0 or later. You can enable code analysis on projects that target earlier .NET versions by setting the EnableNETAnalyzers property to true.
Install analyzers as a NuGet package. The analyzers are also available in the Microsoft.CodeAnalysis.NetAnalyzers NuGet package.
More details on how to set up .NET analyzers can be found here.
Code Quality
Code analysis rules have various configuration options. You specify these options as key-value pairs in one of the following analyzer configuration files:
- EditorConfig file: File-based or folder-based configuration options
- Global AnalyzerConfig file (Starting with the .NET 5 SDK): Project-level configuration options; useful when some project files reside outside the project folder
EditorConfig files are used to provide options that apply to specific source files or folders; for example:
# CA1000: Do not declare static members on generic types
dotnet_diagnostic.CA1000.severity = warning
Code Style
We can define code style settings per project by using an EditorConfig file, or for all code, we edit in Visual Studio on the text editor Options page. We can manually populate your EditorConfig file, or we can automatically generate the file based on the code style settings you’ve chosen in the Visual Studio Options dialog box. This options page is available at Tools > Options > Text Editor > [C# or Basic] > Code Style > General.
Code style preferences can be set for all of our C# and Visual Basic projects by opening the Options dialog box from the Tools menu. In the Options dialog box, select Text Editor > [C# or Basic] > Code Style > General.
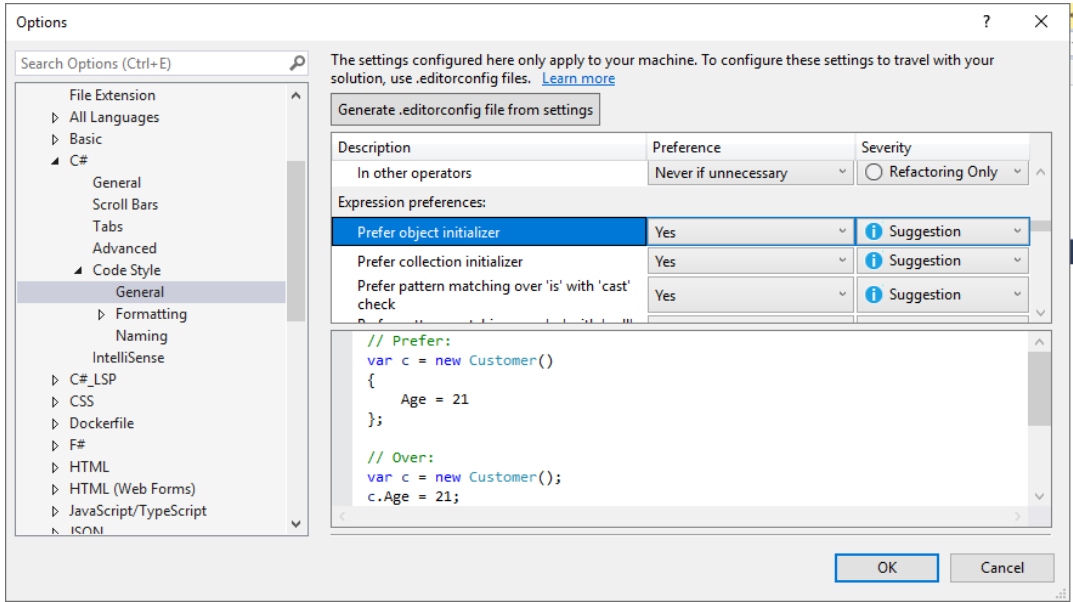
Starting in .NET 5, we can enable code-style analysis on the build, both at the command line and inside Visual Studio. Code style violations appear as warnings or errors with an “IDE” prefix. This enables you to enforce consistent code styles at build time:
Set the MSBuild property
EnforceCodeStyleInBuildto true.In a .editorconfig file, configure each “IDE” code style rule that you wish to run on the build as a warning or an error. For example:
[*.{cs,vb}]
# IDE0040: Accessibility modifiers required (escalated to a build warning)
dotnet_diagnostic.IDE0040.severity = warning
Here we can check the full set of options for Analyzer configuration.
Suppressing Code Analysis Violations
It is often useful to indicate that a warning is not applicable. Suppressing code analysis violations indicates team members that the code was reviewed, and the warning can be suppressed. We can suppress it in the EditorConfig file by setting severity to none. For example:
dotnet_diagnostic.CA1822.severity = none
Also, we can do so directly in source code by using attributes or a global suppression file. Here is an example of using SuppressMessage attribute:
[Scope:SuppressMessage("Rule Category", "Rule Id", Justification = "Justification", MessageId = "MessageId", Scope = "Scope", Target = "Target")]
The attribute can be applied at the assembly, module, type, member, or parameter level.
Using SonarQube

SonarQube is an open-source product, produced by SonarSource SA, which consists of a set of static analyzers (for many languages), a data mart, and a portal that enables you to manage your technical debt. SonarSource and the community provide additional analyzers (free or commercial) that can be added to a SonarQube installation as plug-ins
From SonarSource we have three possible options:
- SonarQube: A tool/server that needs to be installed/hosted
- SonarCloud: Cloud variant of Sonar analyzers, only registration needed
- SonarLint: IDE extension
- SonarAnalyzer.CSharp: This is a set of code analyzers delivered via a NuGet package. You can install them in any .NET project and use them for free, even without an extension or paid subscription for any other products.
They allow us 380+ C# rules and 130+ VB.NET rules and different metrics (cognitive complexity, duplications, number of lines, etc.), but also support for adding custom rules.
Using SonarQube Locally
To use SonarQube locally, we first need to install it from a ZIP file or from a Docker image.
When the installation is done, we need to run StartSonar.bat in administration mode and the SonarQube application will be running at http://localhost:9000.
Now, we can create a project and create a unique token:
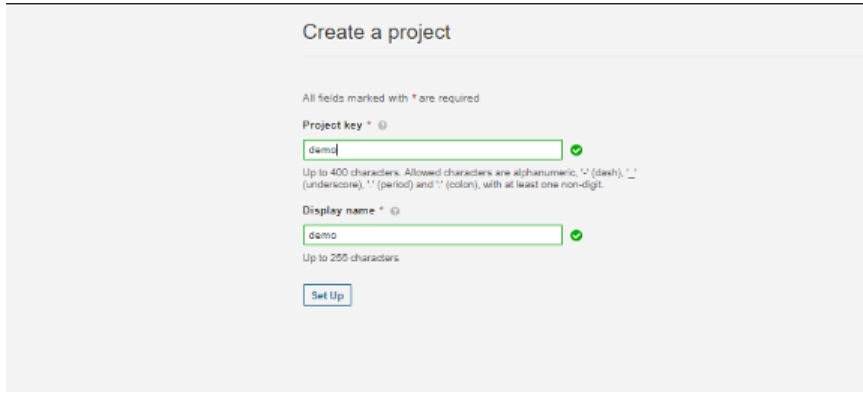
Before analyzing a project, we need to install SonarScanner tool globally, like:
dotnet tool install --global dotnet-sonarscanner
Then we can execute the scanner:
dotnet sonarscanner begin /k:"demo" /d:sonar.host.url="http://localhost:9000"  /d:sonar.login="token"

dotnet build

dotnet sonarscanner end /d:sonar.login="token"
We can see the results of the analysis. In this dashboard, we can see bugs, vulnerabilities, code smells, code coverage, security issues, and more.
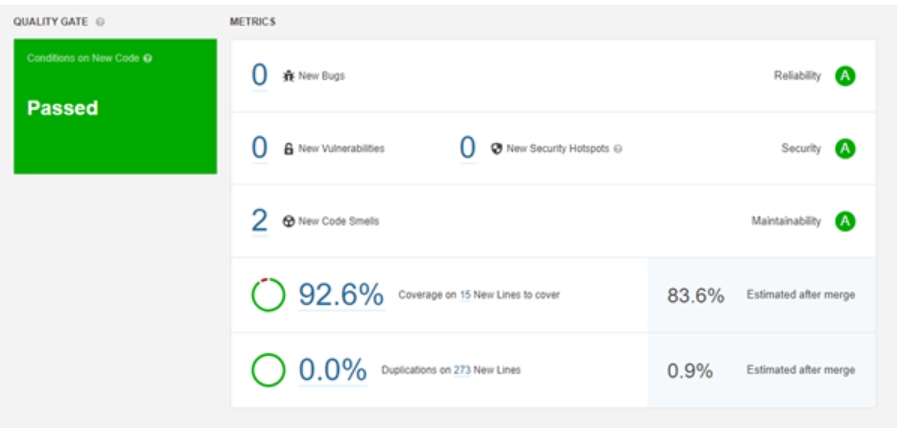
Using SonarAnalyzer
One additional tool that we can use, instead of SonarLint is SonarAnalyzer.CSharp, the analyzers package. This package enables us to have IDE integration to have the same rules applied when building applications locally like it was built in CI/CD process with SonarQube rules applied. As it is integrated into the MSBuilds process, we can easily switch on/off rules in a .ruleset file.
All the rules have documentation with a clear explanation of the problem, and code samples showing good and bad code (see an example).
Using SonarCloud in the Cloud
Another possibility is to use SonarCloud integration with your repository from GitHub, Bitbucket, Azure DevOps, or GitLab. Here we can have straightforward configuration, where we just create a SonarCloud account/project and connect it to our online repository that will be analyzed. A free version of SonarCloud offers unlimited analyzers and lines of code for all languages, but results will be open to anyone. Analysis for private projects is paid from 10e per month.
In the example here a popular NopCommerce open-source project is analyzed with connection to SonarCloud (results), as an open project. In the image below we can see the result of the SonarQube analysis in the dashboard.
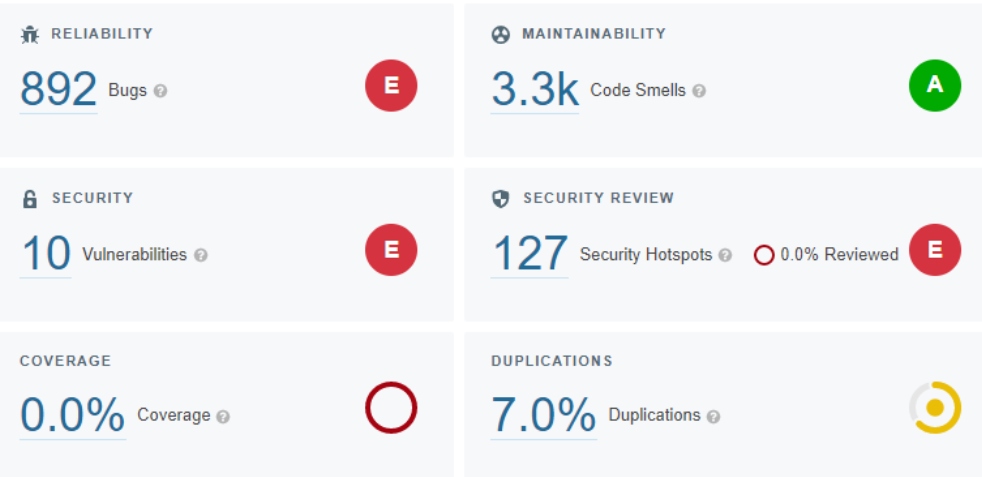
What we can see from the results of scanning 337k of code is that we have 892 bugs, 3.3k code smells, but also 10 security vulnerabilities and 127 security hotspots. Then, we can go into detail in each of those sections. For example, code smells:
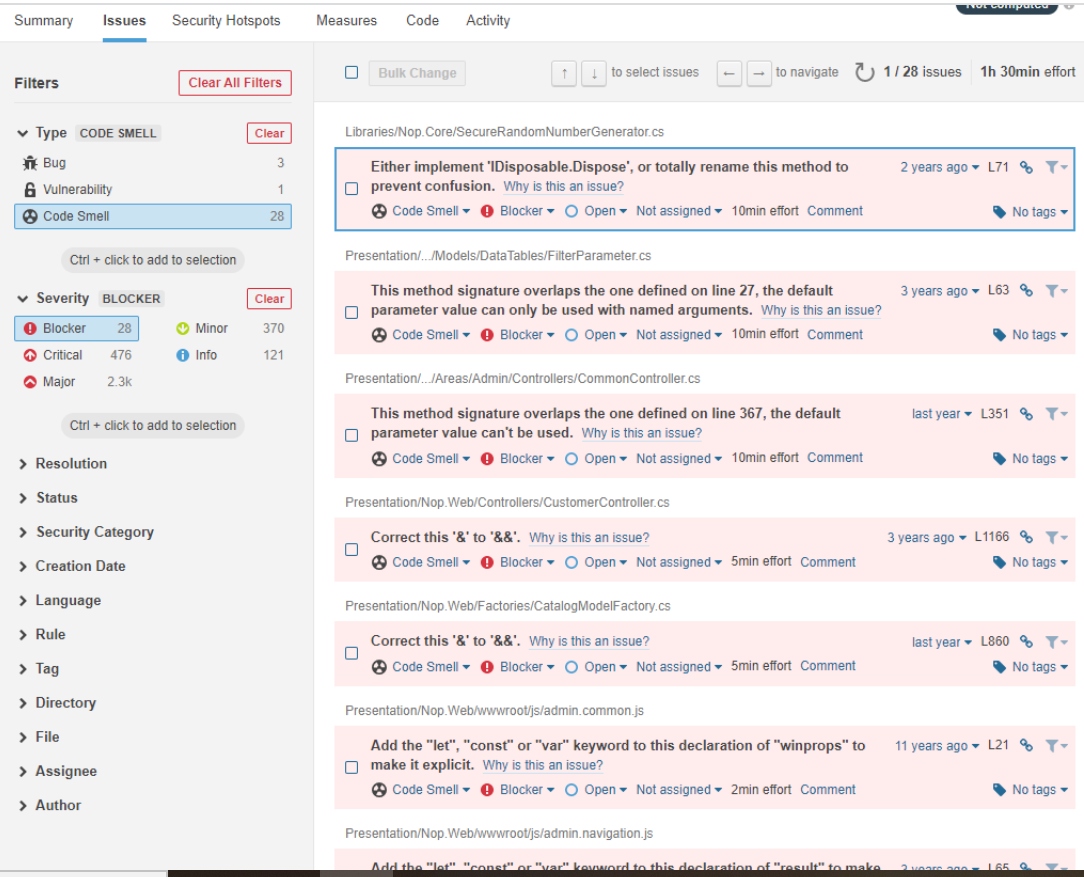
Here is important to check for blocker, critical and major findings. For each of the issues, we can see details of why that is the issue, we can confirm it, or resolve it.
When we fix the issue and push our changes to the repository, we will see a new round of analysis that incorporated our changes.
Using SonarQube in CI/CD Pipelines
We can integrate SonarQube in CI/CD pipelines in GitHub, GitLab, BitBucket, Jenkins, Travis, and Azure DevOps. Community edition allows only scanning for the master branch, but from Developer Edition it’s possible to analyze multiple branches.
To use SonarQube in the example of Azure DevOps, we need to set up our global DevOps Platform settings and add an access token. Then, we can analyze the process with Azure pipelines. First, we need to install the SonarQube extension. After installing your extension, you need to declare your SonarQube server as a service endpoint in our Azure DevOps project settings.
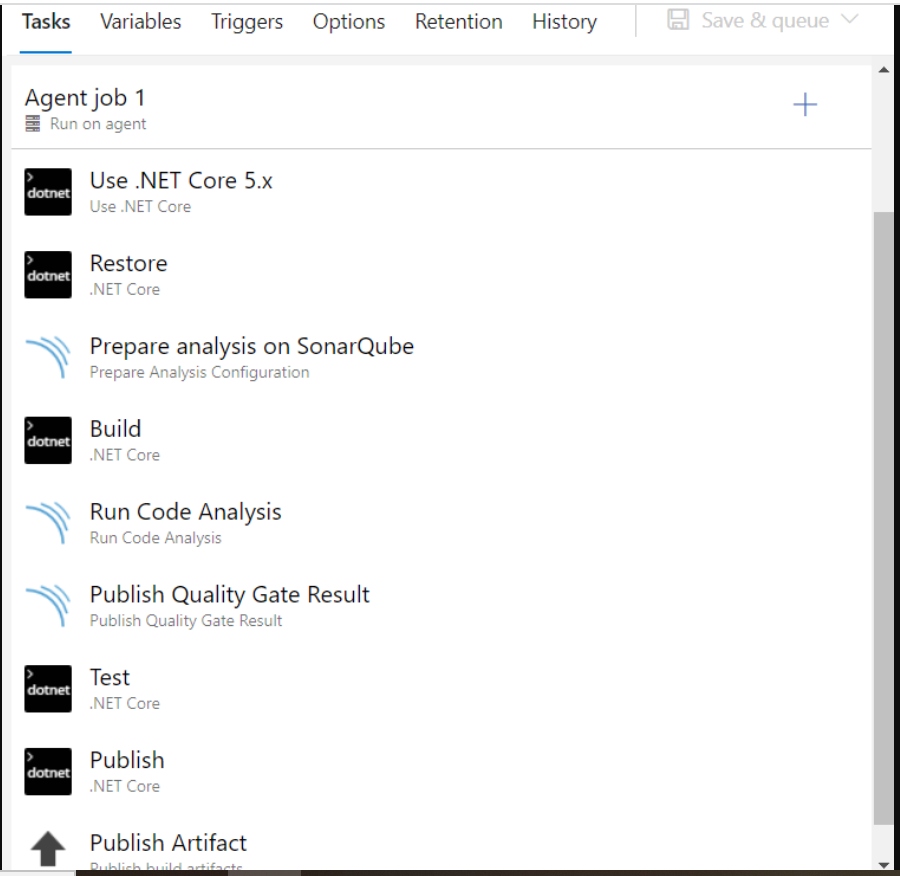
When the endpoint is added, we need to configure branch analysis by using the following tasks: Prepare Analysis Configuration, Run Code Analysis and Publish Quality Gate Result.
An example of a pipeline for a .NET project could look like this:
trigger: - master # or the name of your main branch
- feature/*
steps:
# Prepare Analysis Configuration task
- task: SonarQubePrepare@5  inputs:    SonarQube: 'YourSonarqubeServerEndpoint'    scannerMode: 'MSBuild'    projectKey: 'YourProjectKey'

# Run Code Analysis task
- task: SonarQubeAnalyze@5
# Publish Quality Gate Result task
- task: SonarQubePublish@5  inputs:    pollingTimeoutSec: '300'
An example of the full Azure DevOps pipeline in the classic mode:
What is also important is that we want to run this check with every pull request. This will prevent unsafe or substandard code from being merged with our main branch. Two policies that can help us here:
Ensuring your pull requests are automatically analyzed: Ensure all of your pull requests get automatically analyzed by adding a build validation branch policy on the target branch.
Preventing pull request merges when the Quality Gate fails: Prevent the merge of pull requests with a failed Quality Gate by adding a SonarQube/quality gate status check branch policy on the target branch.
Conclusion
In this post, we saw how we can use different tools to automatize checks for high-quality code. This is important as we know that high-quality code is cheaper to produce. There are multiple benefits of this approach in long term, as you have the confidence to release more frequently and have a quicker time to market. With this approach, we also reduce business risks.
Some rules may sometimes get in your way and slow down your development, but you and your team are in charge to establish given rules or completely ignore disabling them. In addition, the lack of a standardized code formatter in .NET that languages like GO have gives far too much freedom in how people format their code, and that has a major impact on readability, and therefore maintainability.
Published at DZone with permission of Milan Milanovic. See the original article here.
Opinions expressed by DZone contributors are their own.

Comments