Dropwizard Part 3: Measuring Your Application Metrics
In the third part of our Dropwizard exploration, we'll look at measuring application metrics with meters, gauges, timers, and histograms!
Join the DZone community and get the full member experience.
Join For FreeAt some point in their lifetime, almost all applications need the ability to report key statistics; the latency of a certain method is fairly standard, but also internal application state as well as longer term averages and application health checks. One of the things that always surprised me was the lack of a standard library or way of doing these things in Java; my teams always ended up manually instrumenting the code and then either exposing information via a web page or JMX. There is always the inherent risk our instrumentation would slow down or break the application, it required maintaining and it always took longer to write than first expected.
As a result, I was really intrigued to discover Metrics, part of the Dropwizard libraries. This has been written by the Dropwizard team from the ground up to solve this standard problem in a simple way. It can be used completely separately to Dropwizard and is simple to add into the code base. Even better it comes with a variety of reporting methods out of the box, including console, JMX, and Grafana.
Meters, Gauges, Histograms, and Timers, Oh My!
Meters
Meters measure the number of events over time. It’s very basic and given the other options you’re unlikely to use a meter although there are certainly cases for it, like counting calls to a method.
If I wanted to count how many times my newMessage() method was called over different periods, for example, all I would need to do is add a few lines of code:
  private final MetricRegistry metrics = new MetricRegistry();

 private final Meter requests = metrics.meter("requests");

 @POST
    public ChatroomView newMessage(
        @PathParam("userOne") Optional<String> from,
        @PathParam("userTwo") Optional<String> to,
        @FormParam("message") Optional<String> message
    ) {
        requests.mark();
        String formattedMessage = from.get() + ": " + message.get() + "";
        chats.addMessageToChat(from.get(), to.get(), formattedMessage);
        return chatBetween(from, to);

    }
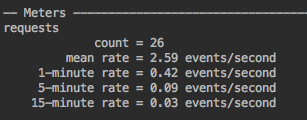
I create a new meter called “requests”, and every time I want to record an event I call the mark() function.
When this is reported, I will then get average number of calls per second (events/second) and the 1, 5 and 15 minute

Gauges
Gauges are used for reporting any stat of your choosing; it can even be of any type. It allows you to expose state through the metrics system with ease. The Gauge interface is simple:
public interface Gauge<T> extends Metric {
    T getValue();
}
So as an example, in my chat app, I currently hold all chats in a big list. It’s probably a good idea to know how big a list that is, so I can stick that into a Gauge.
 metrics.register(MetricRegistry.name(Chats.class, "chatSize"),
            (Gauge<Integer>) () -> chats.size());
Every time my Metrics reports I will now find out the size of the list. This ability to easily expose internal stats will be incredibly powerful in a large scale application. Whilst nothing here is groundbreaking, it's an exceptionally simple way to report internals and it has a clean separation of concerns between the instrumentation and reporting. Whether you log the stats to the console or expose them via JMX is completely separate from the way the code is instrumented.
Metrics also provides a distinct Counter type, which is just a Gauge for an AtomicInteger. It exposes inc() and dec() operators, so if you want to expose a count of something it’s simple to
Timers
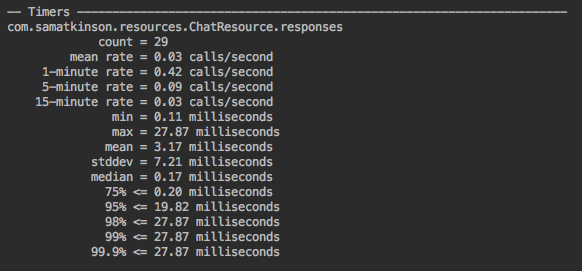
Ever had to write code to evaluate how long each call is taking to try and find out what outliers you’ve got? Thought so. Timers provides this out the box. At the start of the method call (or whatever you want to time) you call the method time(), at the end you call stop(), and Metrics takes care of the rest, providing a full histogram, set of averages and the min and max.
Imagine I wish to profile how long it takes each time I want to return the details of a chatroom. Here’s what the code looks like
 final Timer.Context context = responses.time();//1

        try {
            String userOneName = userOne.get();
            String userTwoName = userTwo.get();
            return new ChatroomView(userOneName, userTwoName, chats.chatBetween(userOneName, userTwoName),
                chats.belongingTo(userOneName)
                    .stream()
                    .map(c -> new ChatView(userOneName, c))
                    .collect(toList()));
        } finally {
            context.stop();//2
        }
At 1 and 2, I start and stop the timer. Here are all the fields that are reported as shown in the Console Reporter:

Histograms
The documentation describes this best:
"A histogram measures the statistical distribution of values in a stream of data. In addition to a minimum, maximum, mean, etc., it also measures median, 75th, 90th, 95th, 98th, 99th, and 99.9th percentiles."
It’s very similar to the timer, except you can record absolutely any values you want.
Reporting the stats
This is my favorite part of Metrics. There are absolutely tons of ways to report your statistics which have already been build; you just need to plug in. Logging to the console? Covered. Push into JMX? Done. There’s even an implementation to send to Grafana (a tutorial for another day).
Let’s look at the console one to keep things easy.
ConsoleReporter reporter = ConsoleReporter
            .forRegistry(metrics)
            .convertRatesTo(TimeUnit.SECONDS)
            .convertDurationsTo(TimeUnit.MILLISECONDS)
            .build();

        reporter.start(10, TimeUnit.SECONDS);
Simply plug in what format you want your statistics (convertRatesTo changes the “events per X”, convertDurationsTo changes the reporting of time periods) and how often you want stats logging out.
Follow me on Twitter for more at @SambaHK
Opinions expressed by DZone contributors are their own.

Comments