Best Practices: Performance Tuning Real Life MuleSoft APIs
In this post, we offer some insights into how to avoid pitfalls and achieve development efficiency, performance, and scalability.
Join the DZone community and get the full member experience.
Join For FreeDigital Transformation via APIs
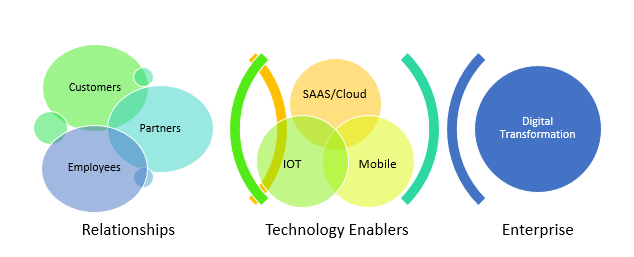
Before we dive into the design verbiage, a quick word to appreciate the need for APIs, and how the evolution and performance of these are driving the shape of Digital Transformation across the enterprises.
As we are aware of today’s always-on world, where the clientele has grown from a typical 8-to-5 customer base to a 24X7 userbase comprising of customers, clients, partners and employees that are accessing systems round the clock and across the devices, and this demand for availability coupled with elastic scaling support of cloud-based platforms and services, the possibilities of exposing the business data and functionalities delving down in back-end systems of the enterprise to the end consumer are immense. With chatty devices (read IoT) coming into the picture, it opens a whole new dimension and expands the magnitude at which APIs will need to be served and consumed. And this is where API platforms like Mulesoft come into the picture, as such platforms help tremendously in catalyzing this effort.
Going through the whitepapers and other documentation, it is easy to get carried away and start expecting blazing performance from the Mulesoft APIs right from the word go. Imagine the IT team looking at these white papers and giving a nod to the ever-growing performance and volume of business. The promise is definitely not misplaced but one needs to bring into consideration the nature of the APIs - the layering involved, the complexity, the amount of orchestration, the grind per API and so on. Herein, an effort has been made to bring into consciousness all the points that need to be brought into consideration before arriving at any volume predictions and making any performance commitments.
Now the whole concept is only as important as it could perform under high loads which brings us to have a view into some of the pitfalls that might come our way, and how to avoid them.
Baking in API-Led Connectivity During Capacity Planning
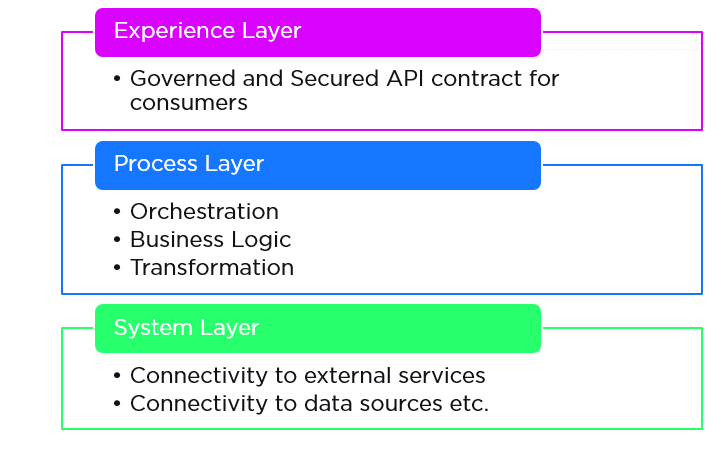
It is a great practice to have the APIs layered as Experience APIs, Process APIs, and System APIs, which helps in keeping the APIs and respective responsibilities for supporting and managing these APIs distributed.

This is well documented by Mule in their documentation. The only watch-out here is that while carrying out Capacity Planning (identifying, say, the number of VMs, cores, memory, and disk space requirements, etc.), it is important to keep in mind the API-led-connectivity approach, and account for all the APIs and orchestration that will need to be supported throughout.
Architects and designers need to not just account for the holistic set of Business APIS to be supported, but also bake into it the fact that each Business API will go through a series of API orchestrations and which will amount to an equivalent set of APIs to be supported in terms of computing resources (the CPU utilization, the number of threads, the memory, I/Os etc.) and will also add to latency in terms of HTTP hops involved. We will talk further on how some of the hops could be optimized.
Accounting for Make-Up of the APIs
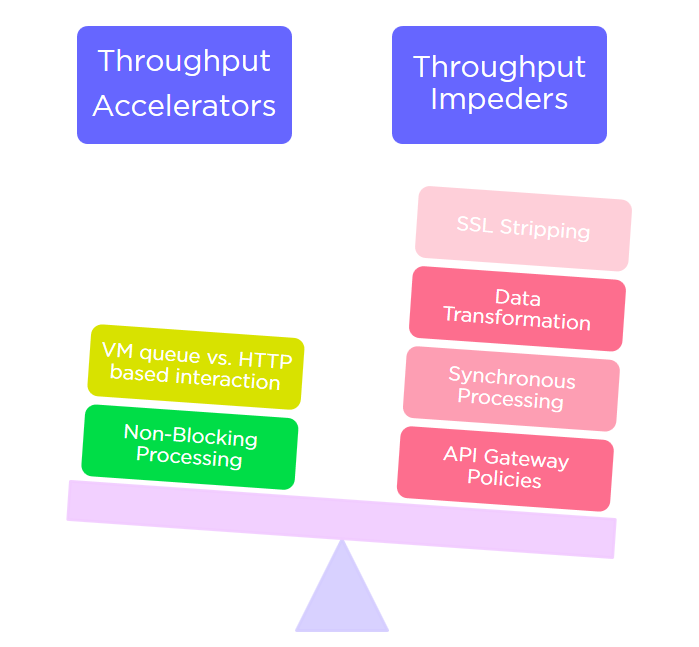
Zooming the same lens a bit further, the designer must understand all pieces of the chain and evaluate predicted throughput and latency based on the make-up of the API. Practically, the whole order of magnitude changes in terms of evaluating performance throughput and latency of any given APIs of varying complexity. While a vanilla proxy API may be claimed to have a throughput in the range of 7K+ TPS for a 2-node cluster, the throughput degrades rapidly if you take into account the more enhanced API features which are generally the norm for a practical, real-world API.

Besides functional complexity, the features that may weigh upon the performance of an API would include:
- API Gateway policies being applied (Security threat mitigation, authentication, Circuit breaker, etc.)
- Blocking vs. Non-blocking processing strategy (this will involve introspection of the processing strategies that are at disposal within Mulesoft).
- Increase in concurrent load (bumps up the need for resources leading to resource crunch).
- Usage of asynchronous messaging implementation (Active MQ) – saves on latency but needs additional resources in SEDA queues.
- Data validation.
- Data Transformation – amount of data weaving, size of the payload, etc.
- HTTP vs. HTTPS – Marginal overheads caused by SSL.
3. Employ a Processing Strategy That Really Fits the Bill
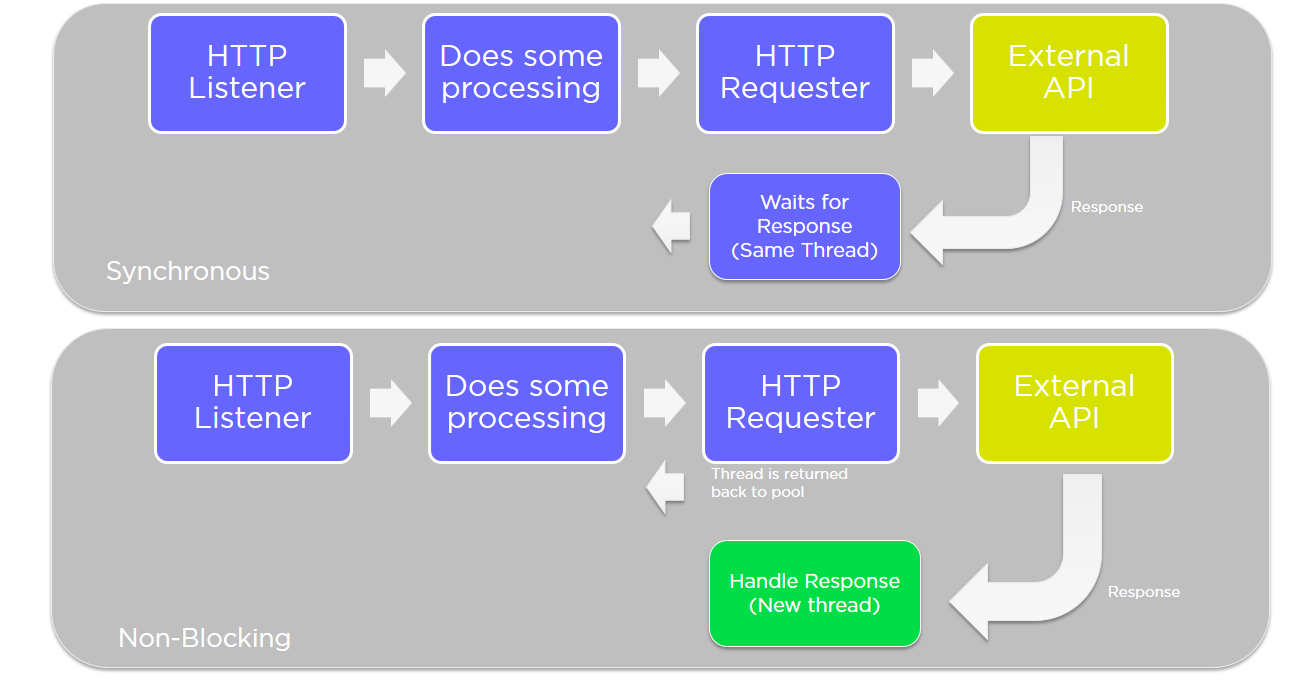
While everything is dealt with in a synchronous fashion within Mule, it does offer many out-of-the-box handy features in terms of breaking up a flow into smaller sub-flows, and more than the improvement in terms of readability, it offers an option to have some of the child flows or segments of flows executed in an asynchronous manner. Further on, the moment things become asynchronous the clustering features within Mule become more beneficial in that the asynchronous flows could be taken up by any of the nodes within the cluster, thereby balancing the load across the nodes.

For flows that involve more chatter, typically over HTTP, in terms of integrating with other APIs, Mule offers a ‘non-blocking’ processing strategy specifically designed to counter the need to wait for HTTP requester threads while the response is being expected.
<flow name="order-api-implFlow" processingStrategy="Non_Blocking_Experience_API_Strategy">

<non-blocking-processing-strategy name="Non_Blocking_Experience_API_Strategy"
    minThreads="${Non_Blocking_Experience_API_Strategy.minThreads}"
    maxThreads="${Non_Blocking_Experience_API_Strategy.maxThreads}"
doc:name="Non-blocking Processing Strategy for Experience API"/>
The Grizzly-based NIO implementation makes sure to relieve the requester thread, and spawns off a new thread altogether based on the response receipt event.
Further on, the configuration also allows you to define the bracket for the number of threads that could take part in the play.
Enhancing Resource Utilization Across Nodes in a Cluster
To take the approach a step further, it is advised to have more complex flows broken down into child flows, generally having a transport connector (typically a VM queue) connecting these steps. Mule runtime puts each of these steps in a SEDA queue, allowing different nodes to participate in the execution of a flow – thereby providing a mechanism to balance the load across the nodes even within an API application. This is where clustering in Mule becomes much more effective, besides offering the expected benefits, like high availability through automatic failover and enhanced scalability.
So far we have discussed some of the macro steps that could influence the performance statistics of a Mulesoft API. In addition to these benefits, there are the usual tactical steps or items that one must ensure to achieve high performance out of their APIs. Enlisting a checklist of some of the tactical performance tuning items here:
- OS parameters:
- At OS level (Linux and variants), ensures that it allows for a sufficient number of files to be opened. Check for ulimits - the number of user processes.
- JVM parameters:
- Ensure that enough memory has been allocated w.r.t. the expected load. Bump up the heap size as necessary.
- Ensure the Garbage Collection strategy in use is pertinent to what you expect. Typically, Concurrent Mark and Sweep (CMS) is advised for better latency.
- Make sure that Eden space is sufficient and minor GCs are happening regularly. Make sure that New Gen ratio is in proportion to the overall heap allocation.
- Make sure that major GCs are happening such that memory is reclaimed sufficiently and consistently. Any pattern where you see diminishing returns are symptoms of memory leaks.
- Mule APIs:
- Within Mule, make sure that the thread pools are not maxing out, and that thread profiles are defined independently for each layer of the APIs.
- Make sure that there are no unnecessary ‘synchronized’ blocks within custom code – that might contribute to unnecessary deadlocks.
- Make sure that not too much logging is going on. Avoid unnecessary logging.
- Avoid putting logging steps in Async blocks. Even Async flows consume resources like SEDA queues. Every async does a copy of payload and hence consumes time and resources. Get rid of any Async debug logs, and configure asynchronous behavior at the Log4J level instead.
- Avoid unnecessary DB read/writes. Depending upon the nature of the data being fetched (reference data or master data), it is best to employ the bundled caching features (HazelCast-based) within Mule.
- Tune your DB queries and add indexes where need be.
Cache the DB connections.
Cache the Prepared Statements by use of template-based DB query definition within Mule.
Note that it is very easy to surface many of the Performance bottlenecks by doing a developer-level Performance test and profiling. One can use JMeter as the load generator and any profiling tool such as YourKit or VisualVM to identify symptoms. This, of course, will serve as a precursor to the larger load testing that should happen with the expected production volumes.
Mule runtime version in reference: v3.8
Opinions expressed by DZone contributors are their own.

Comments