Unified Observability Exporters: Metrics, Logs, and Tracing
This second post of a series discussing unified observability with microservices and the Oracle database takes a deeper look at the Metrics, Logs, and Tracing exporters.
Join the DZone community and get the full member experience.
Join For FreeThis is the second in a series of blogs discussing unified observability with microservices and the Oracle database. The first piece went into the fundamentals and basic use cases. This second blog will take a deeper dive into the Metrics, Logs, and Tracing exporters (which can be found at https://github.com/oracle/oracle-db-appdev-monitoring), describing them and showing how to configure them, Grafana, alerts, etc. I will also refer the reader to the latest version of the Unified Observability in Grafana Workshop that has just been published which demonstrates the principles, provides code and configuration examples, etc. All of the code for the workshop can also be found at the https://github.com/oracle/microservices-datadriven repos (specifically in the observability directory).
Particularly with the dawn of microservices, robust observability is an absolute requirement, and the better the tools and techniques used in the space, the more effective and enjoyable observability is for the (DevOps) user and thus the focus on this key area.
Why OpenTelemetry
OpenTelemtry is “A collection of tools, APIs, and SDKs. Use it to instrument, generate, collect, and export telemetry data (metrics, logs, and traces) ” and a CNCF standard. Its main goals are essentially the consolidation and abstraction of existing formats and standards (such as Prometheus for metrics, various logging, Jaeger for tracing, etc.) and automation (such as byte-code manipulation agents) to reduce/remove the need for app/code changes. Therefore, it is a logical step forward in the telemetry and observation space and, though it has been in development since 2019, one that is gaining tremendous adoption recently as evidenced by CNCF's most recent Cloud-native Survey.

Why Grafana
Grafana is clearly the industry-leading console for visualization of various observability data. It is cloud-native and open standards-based, supporting PromQL, Prometheus AlertManger (in addition to its own robust alerting system), etc., and is well suited for fleet, cross-region, etc. while also providing a multi-cloud, portable solution. It is no surprise is has a huge community. It also provides a very lightweight alternative to InfluxDB, Elasticsearch, Splunk, etc.
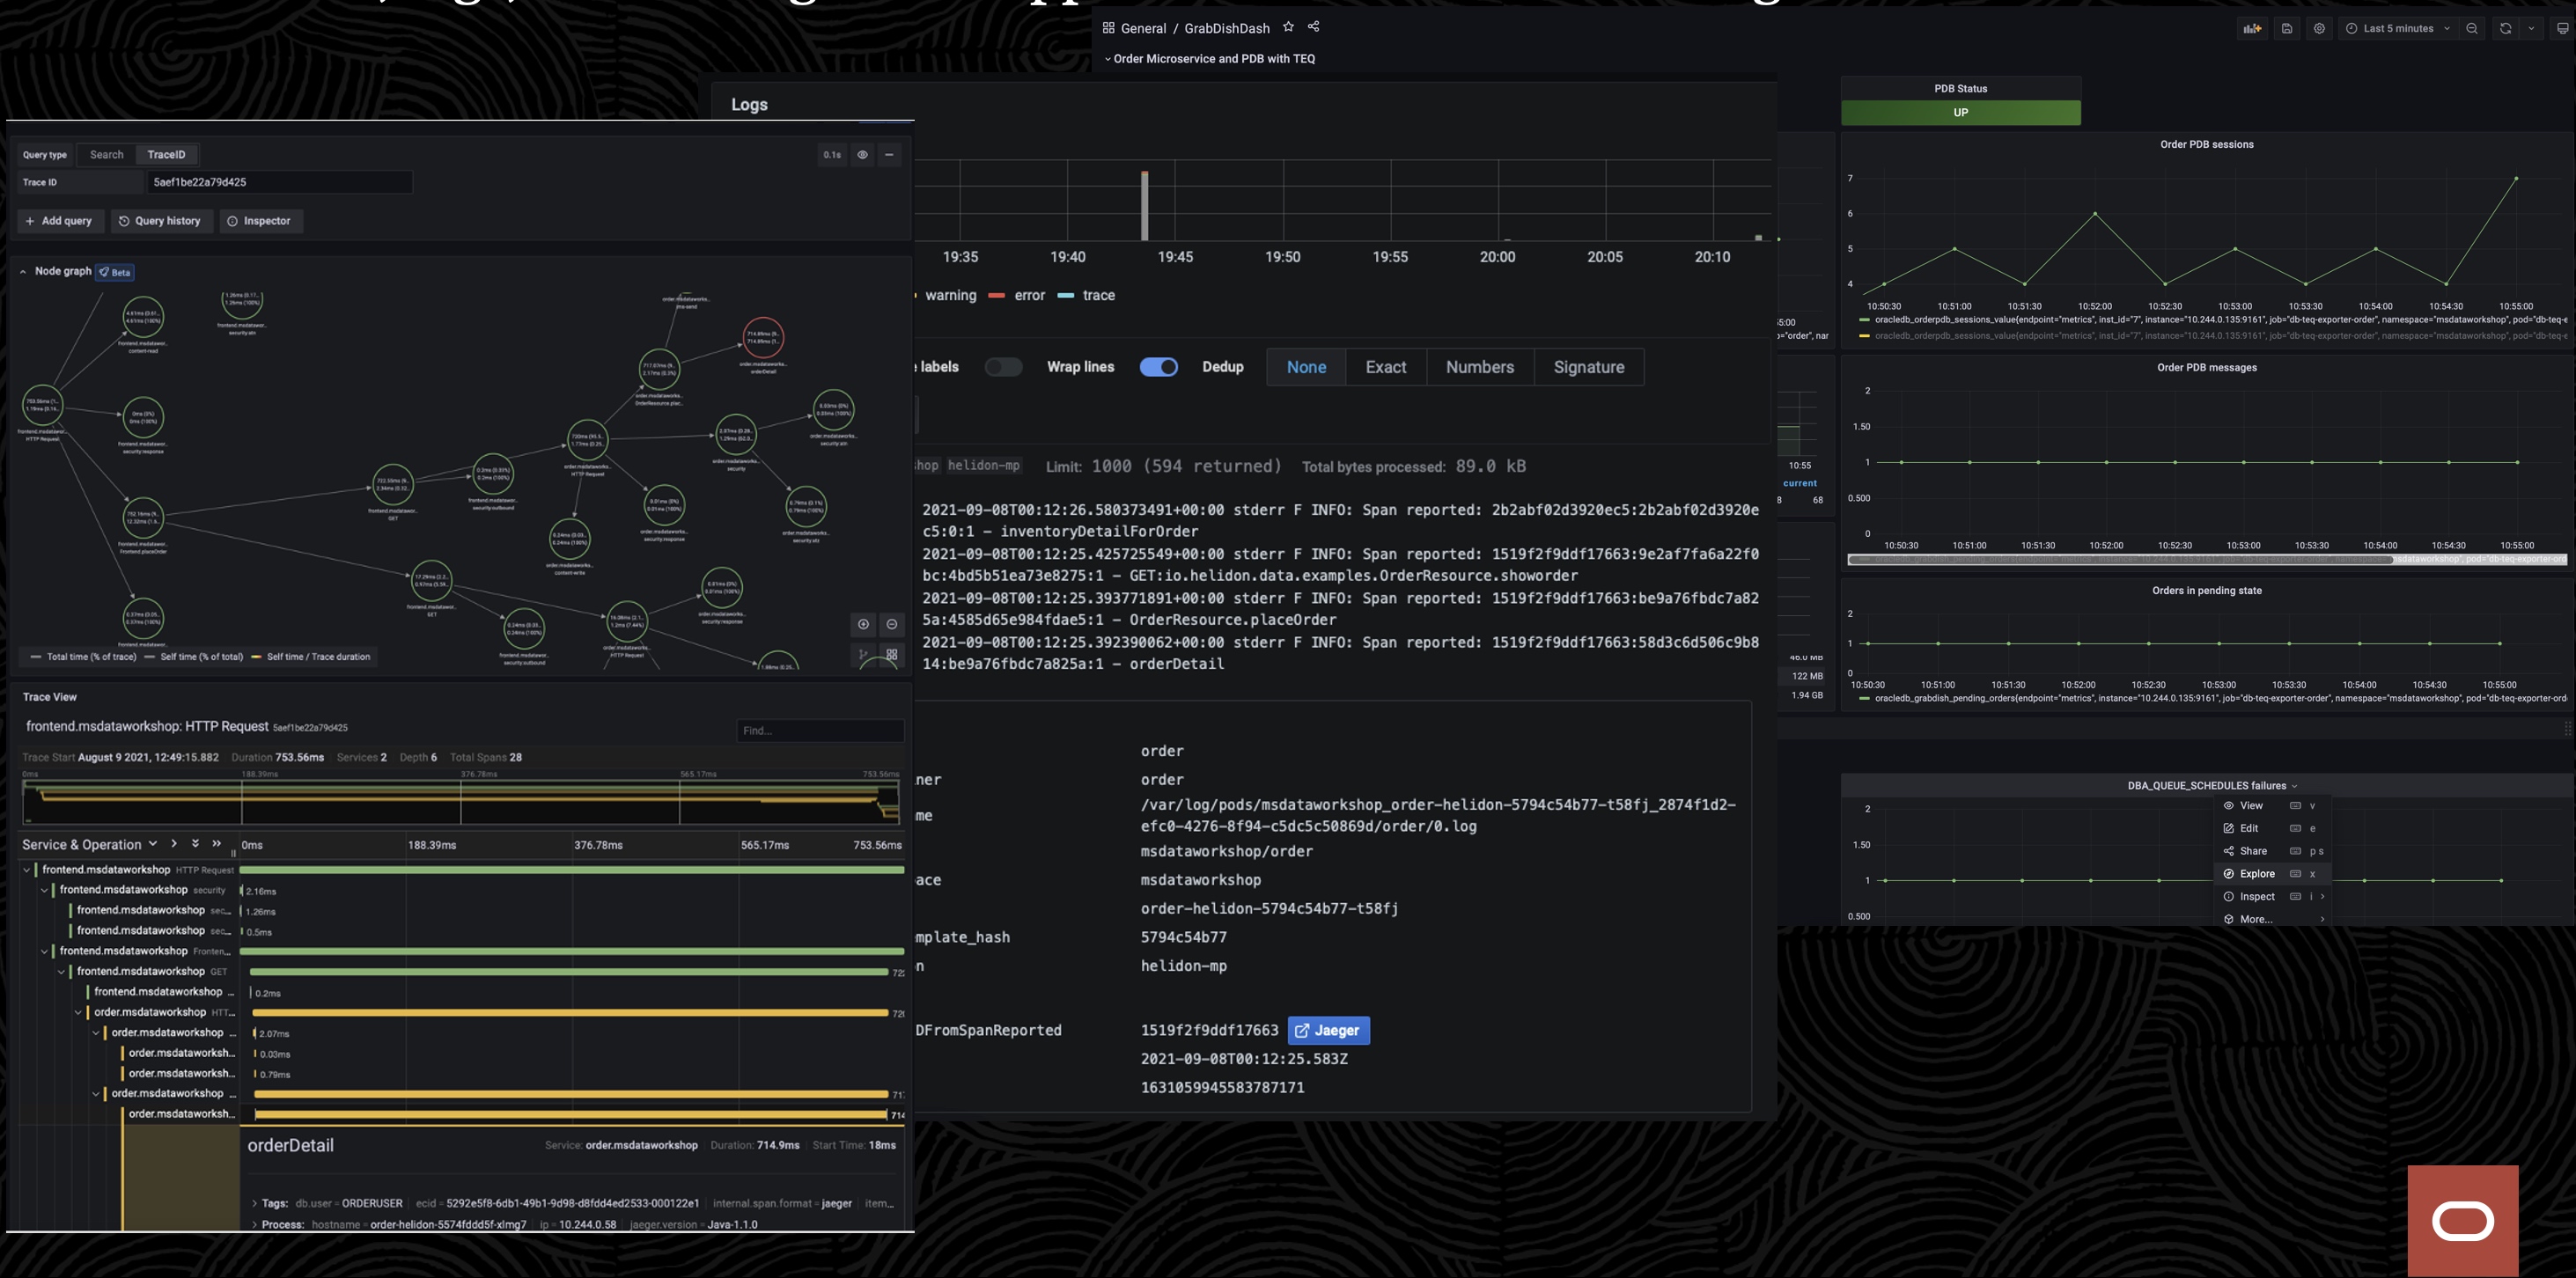
These options, and those of other Oracle-based tools such as Enterprise Manager, are not mutually exclusive with Grafana and may serve different needs, however, coming to the topic at hand, Grafana's ability to provide analysis and correlate metrics, logs, and tracing all within a "single pane of glass" (thus avoiding the need to do such tedious tasks as taking a timestamp from one console and match it up with another, etc.) is a unique and powerful feature well suited for modern applications and microservices in particular. A sample of this is shown below with a click-through drilldown from (Prometheus) metrics, to (Loki/Promtail) logs, to (Jaeger) tracing across frontend, order, and inventory microservices.
Why Oracle Unified Observability
The Oracle Unified Observability solution takes advantage of the single-pane-of-glass and correlations provided by Grafana while supporting OpenTelemetry standards while additionally providing the ability to visualize observability across the application tier (such as, but not limited to, microservices deployed in Kubernetes) and into the database for a complete end-to-end view of a microservices architecture. This is unique and powerful as tracing usually stops at the edge of the database and is limited to client knowledge. It does so by providing an observability exporter for metrics, logs, and tracing that obtains information from the database and provides it to Grafana in the appropriate format.
These exporters exploit the power of SQL in the Oracle database by allowing the user to completely customize what data is provided and to do so dynamically. For example, a metric may be derived from or a log may consist of just particular fields of certain log files combined with particular fields of application data (this even includes the unique qualities of the Oracle converged database to do multi-model queries across JSON, ML, etc.) and a trace may be constructed from arbitrary aspects/fields of a database operation such as a stored procedure. The exporters also avoid the need to access logs directly and inherit all of the security, auditing, and HA that the Oracle database provides.
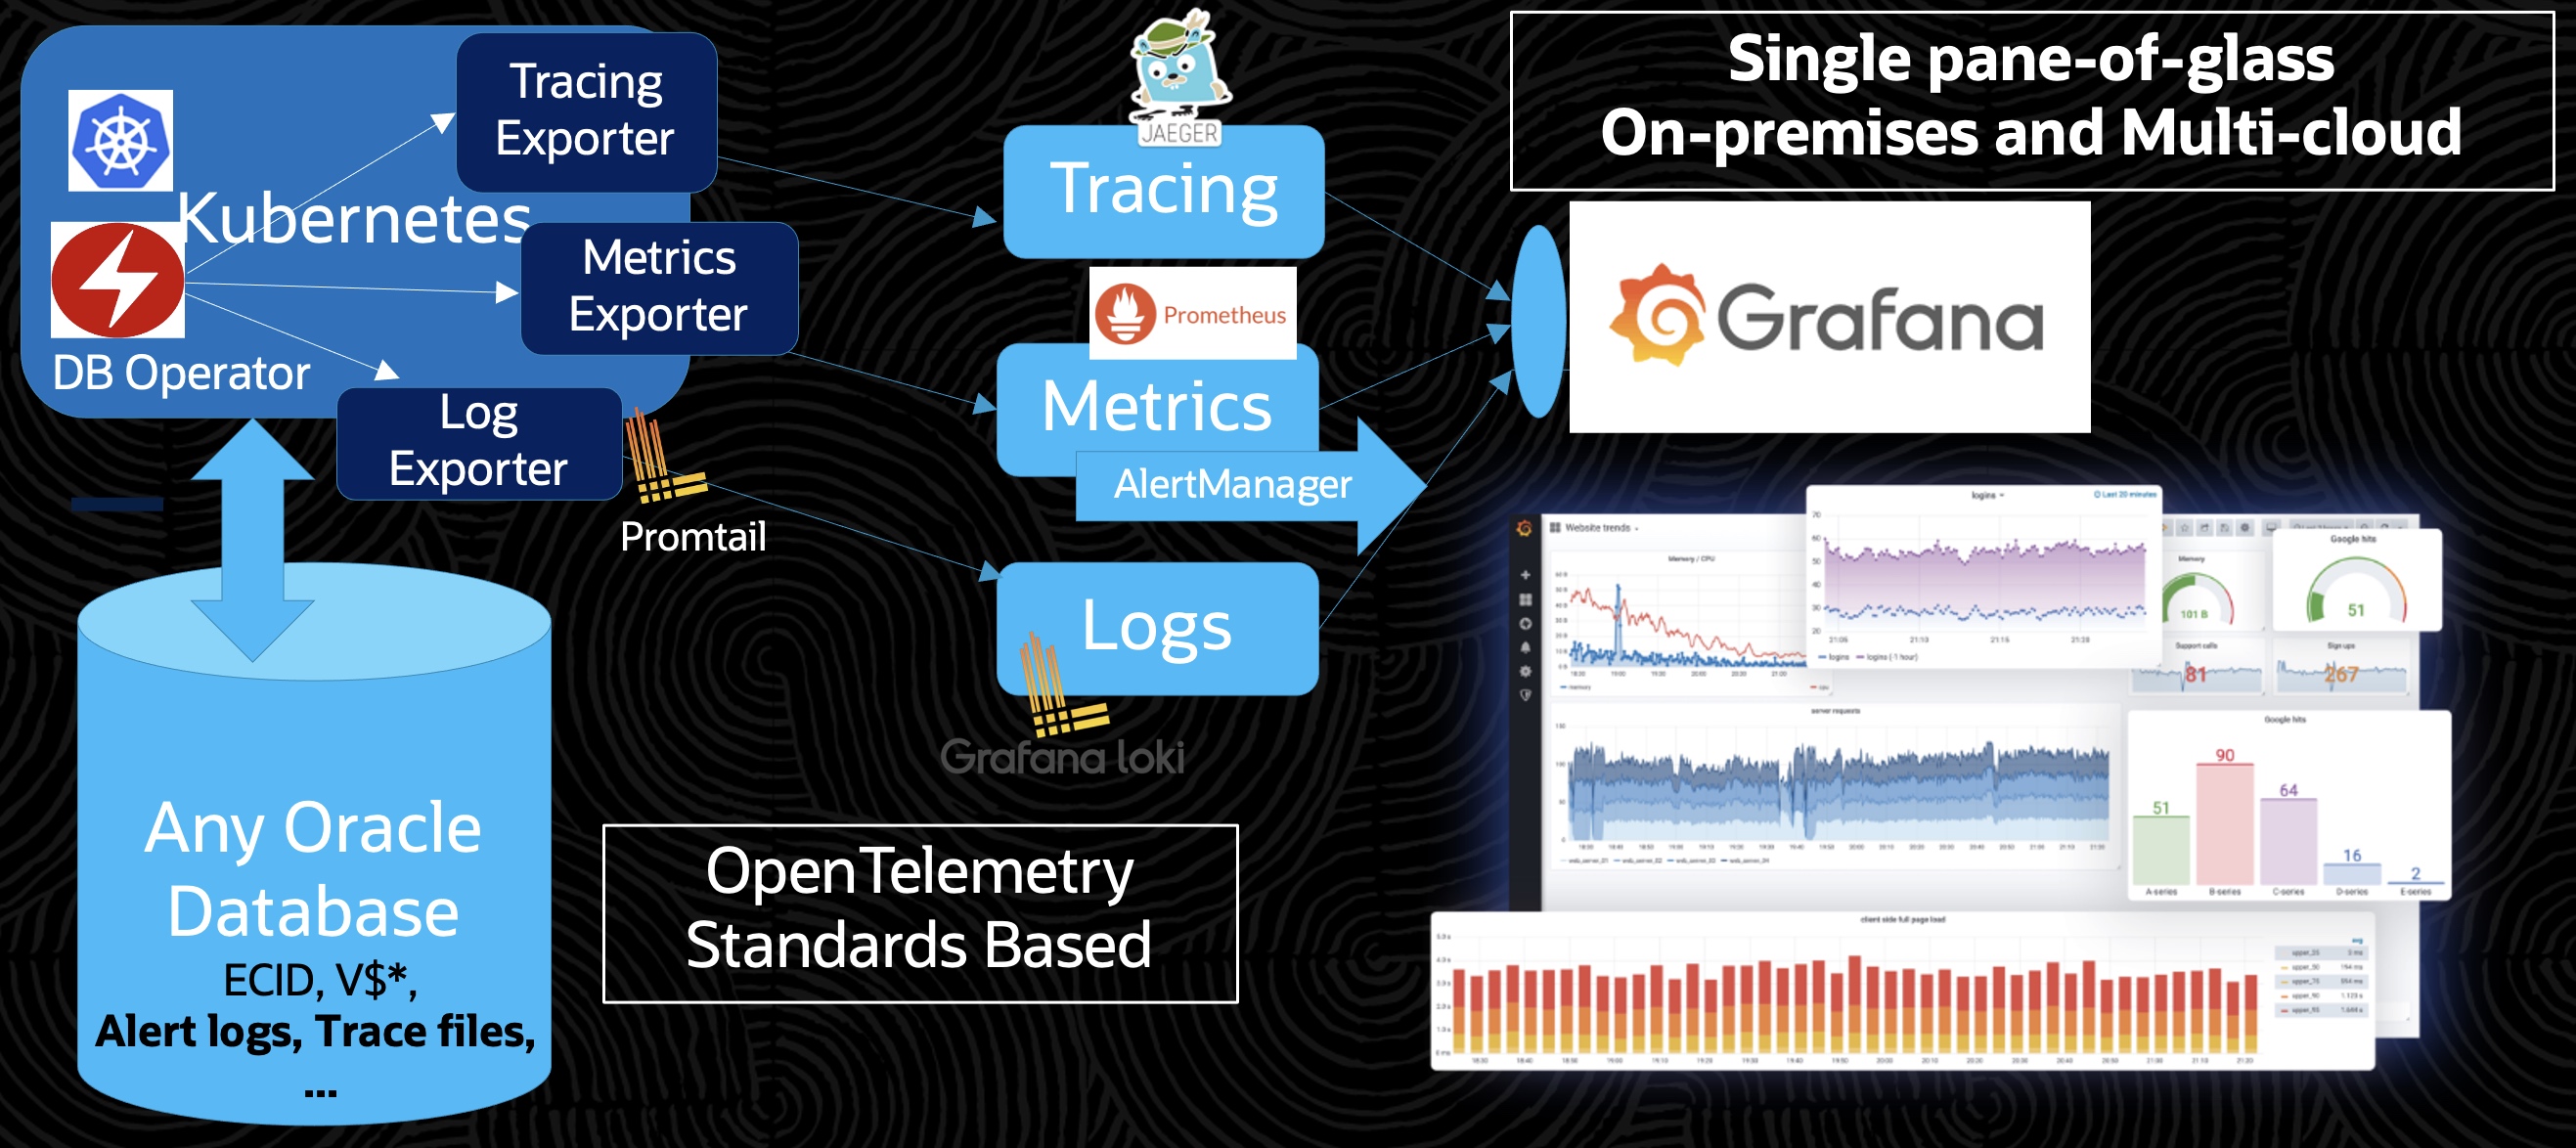
Metrics, logs, and tracing of course all have their own particular characteristics and the Oracle observability exporter is really three exporters (metrics, logs, and tracing exporters) in one. We will take a look at each.
In addition to the functionality, our biggest goal is simplification. The observability exporter requires only database connection information and any custom queries that are desired are easily configured. On the Grafana side is simply a matter of providing the URL of the (Prometheus, Loki, Jaeger) datasource the exporters feed into. Again, I encourage you to check out the workshop mentioned to see just how easy it is.
Metrics Exporter
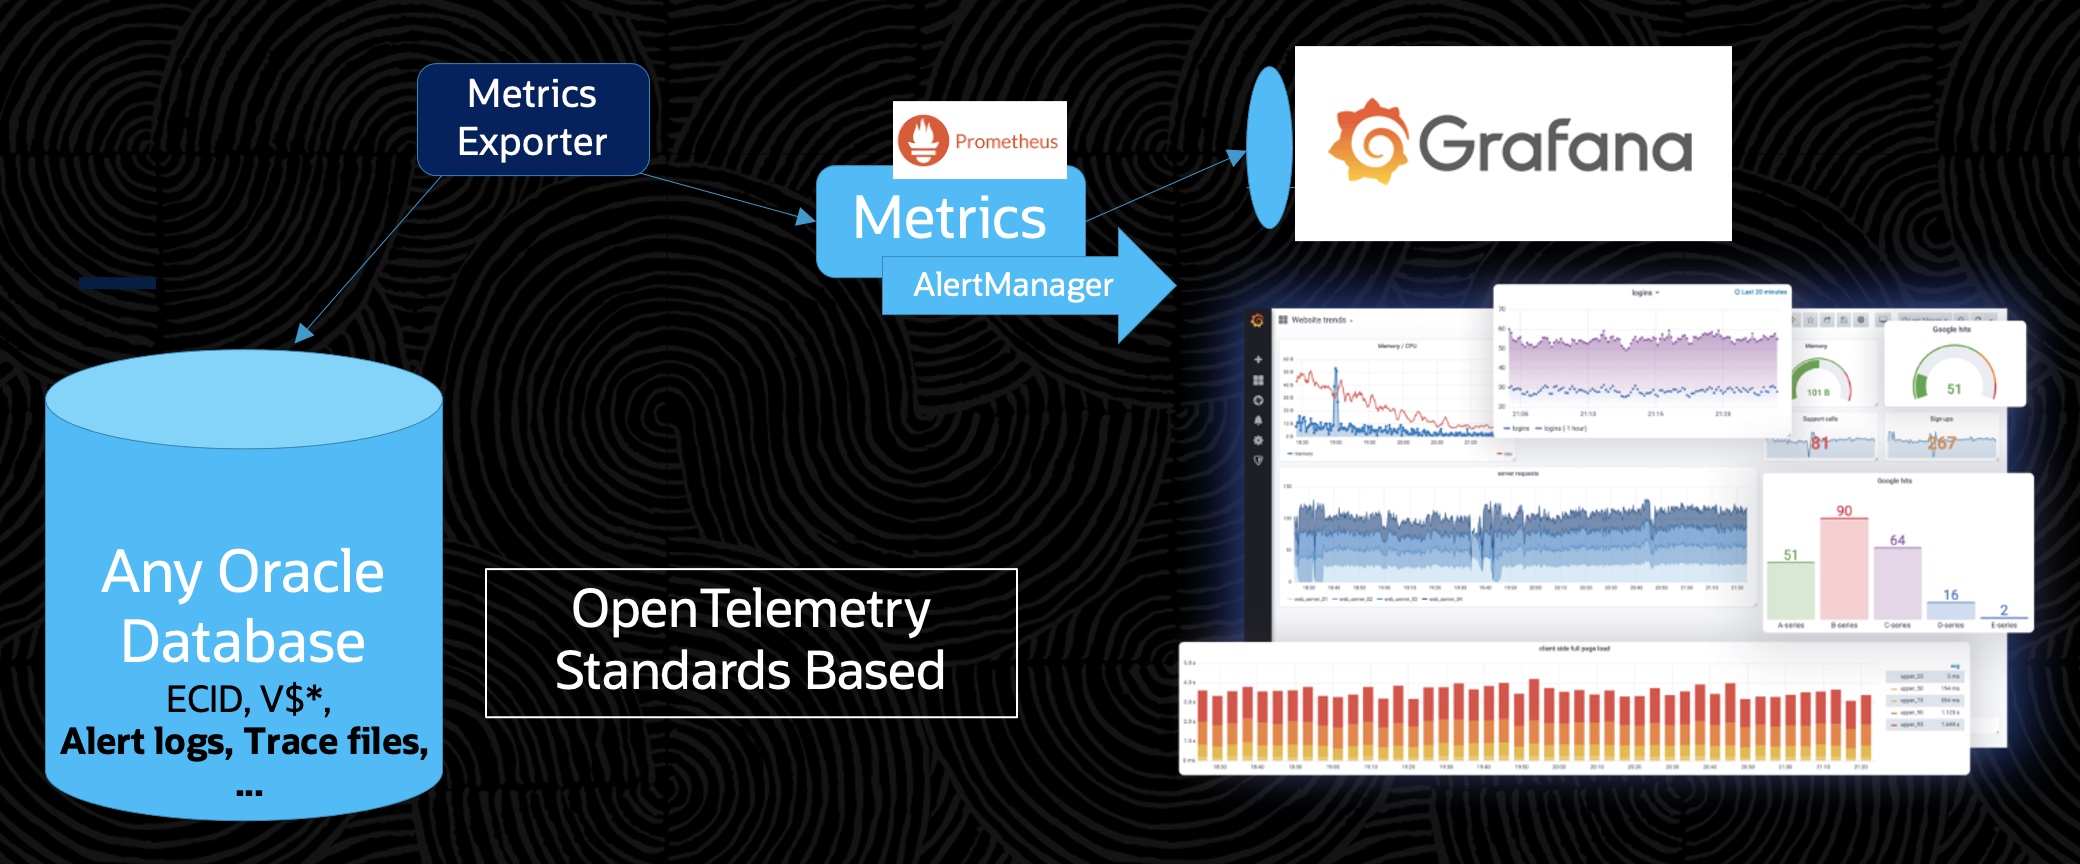
The metrics exporter translates database queries into OpenTelemetry OpenMetrics/Prometheus metrics that are then scraped and presented in Grafana. Queries can be as simple as "select from mytable", but here is an example query configuration that provides information about queues in the Oracle database AQ/TEQ messaging system (see Developing Event-Driven Microservices )
[[metric]]
context = "teq"
labels = ["inst_id", "queue_name", "subscriber_name"]
metricsdesc = { enqueued_msgs = "Total enqueued messages.", dequeued_msgs = "Total dequeued messages.", remained_msgs = "Total remained messages.", time_since_last_dequeue = "Time since last dequeue.", estd_time_to_drain_no_enq = "Estimated time to drain if no enqueue.", message_latency_1 = "Message latency for last 5 mins.", message_latency_2 = "Message latency for last 1 hour.", message_latency_3 = "Message latency for last 5 hours."}
request = '''
SELECT DISTINCT
    t1.inst_id,
    t1.queue_id,
    t2.queue_name,
    t1.subscriber_id AS subscriber_name,
    t1.enqueued_msgs,
    t1.dequeued_msgs,
    t1.remained_msgs,
    t1.message_latency_1,
    t1.message_latency_2,
    t1.message_latency_3
FROM
    (
        SELECT
            inst_id,
            queue_id,
            subscriber_id,
            SUM(enqueued_msgs) AS enqueued_msgs,
            SUM(dequeued_msgs) AS dequeued_msgs,
            SUM(enqueued_msgs - dequeued_msgs) AS remained_msgs,
            AVG(10) AS message_latency_1,
            AVG(20) AS message_latency_2,
            AVG(30) AS message_latency_3
        FROM
            gv$persistent_subscribers
        GROUP BY
            queue_id,
            subscriber_id,
            inst_id
    ) t1
    JOIN gv$persistent_queues t2 ON t1.queue_id = t2.queue_id
'''
Logs Exporter

The logs exporter writes log entries from database queries which are then fed via Promtail to a Loki datasource and presented in Grafana. Here is an example of a simple log query configuration that logs particular fields of an alert log.
[[log]]
context = "orderpdb_alertlogs"
logdesc = "alert logs for order PDB"
timestampfield = "ORIGINATING_TIMESTAMP"
request = "select ORIGINATING_TIMESTAMP, MODULE_ID, EXECUTION_CONTEXT_ID, MESSAGE_TEXT from V$diag_alert_ext"
Tracing Flow
Tracing is a bit unique and so we will first take a look at the tracing flow and how it works with the Oracle exporter.
*All operations involving tracing aspects can be done without code modifications via tracing agents (these work differently between different languages)
- An application/client that is about to make a database call creates a new OpenTelemetry traceid/spancontext.
- This spancontext is sent to the tracing collector (eg Jaeger) by the application/client.*
- The application/client conducts a database call. This call contains a context/session variable (currently the ECID is reused for this purpose and an optional variable will be available in future releases) populated with the OpenTelemetry traceid/spancontext.*
- The call is received by the database and the spancontext is automatically stored so that it can be correlated with related actions in the database via query.
- The tracing exporter queries the database and translates the query information to OpenTelemetry tracing format (eg Jaeger).
- This spancontext is sent to the tracing collector (eg Jaeger) by the tracing exporter.
- The application and database spans are shown as part of the same trace in the Grafana console.
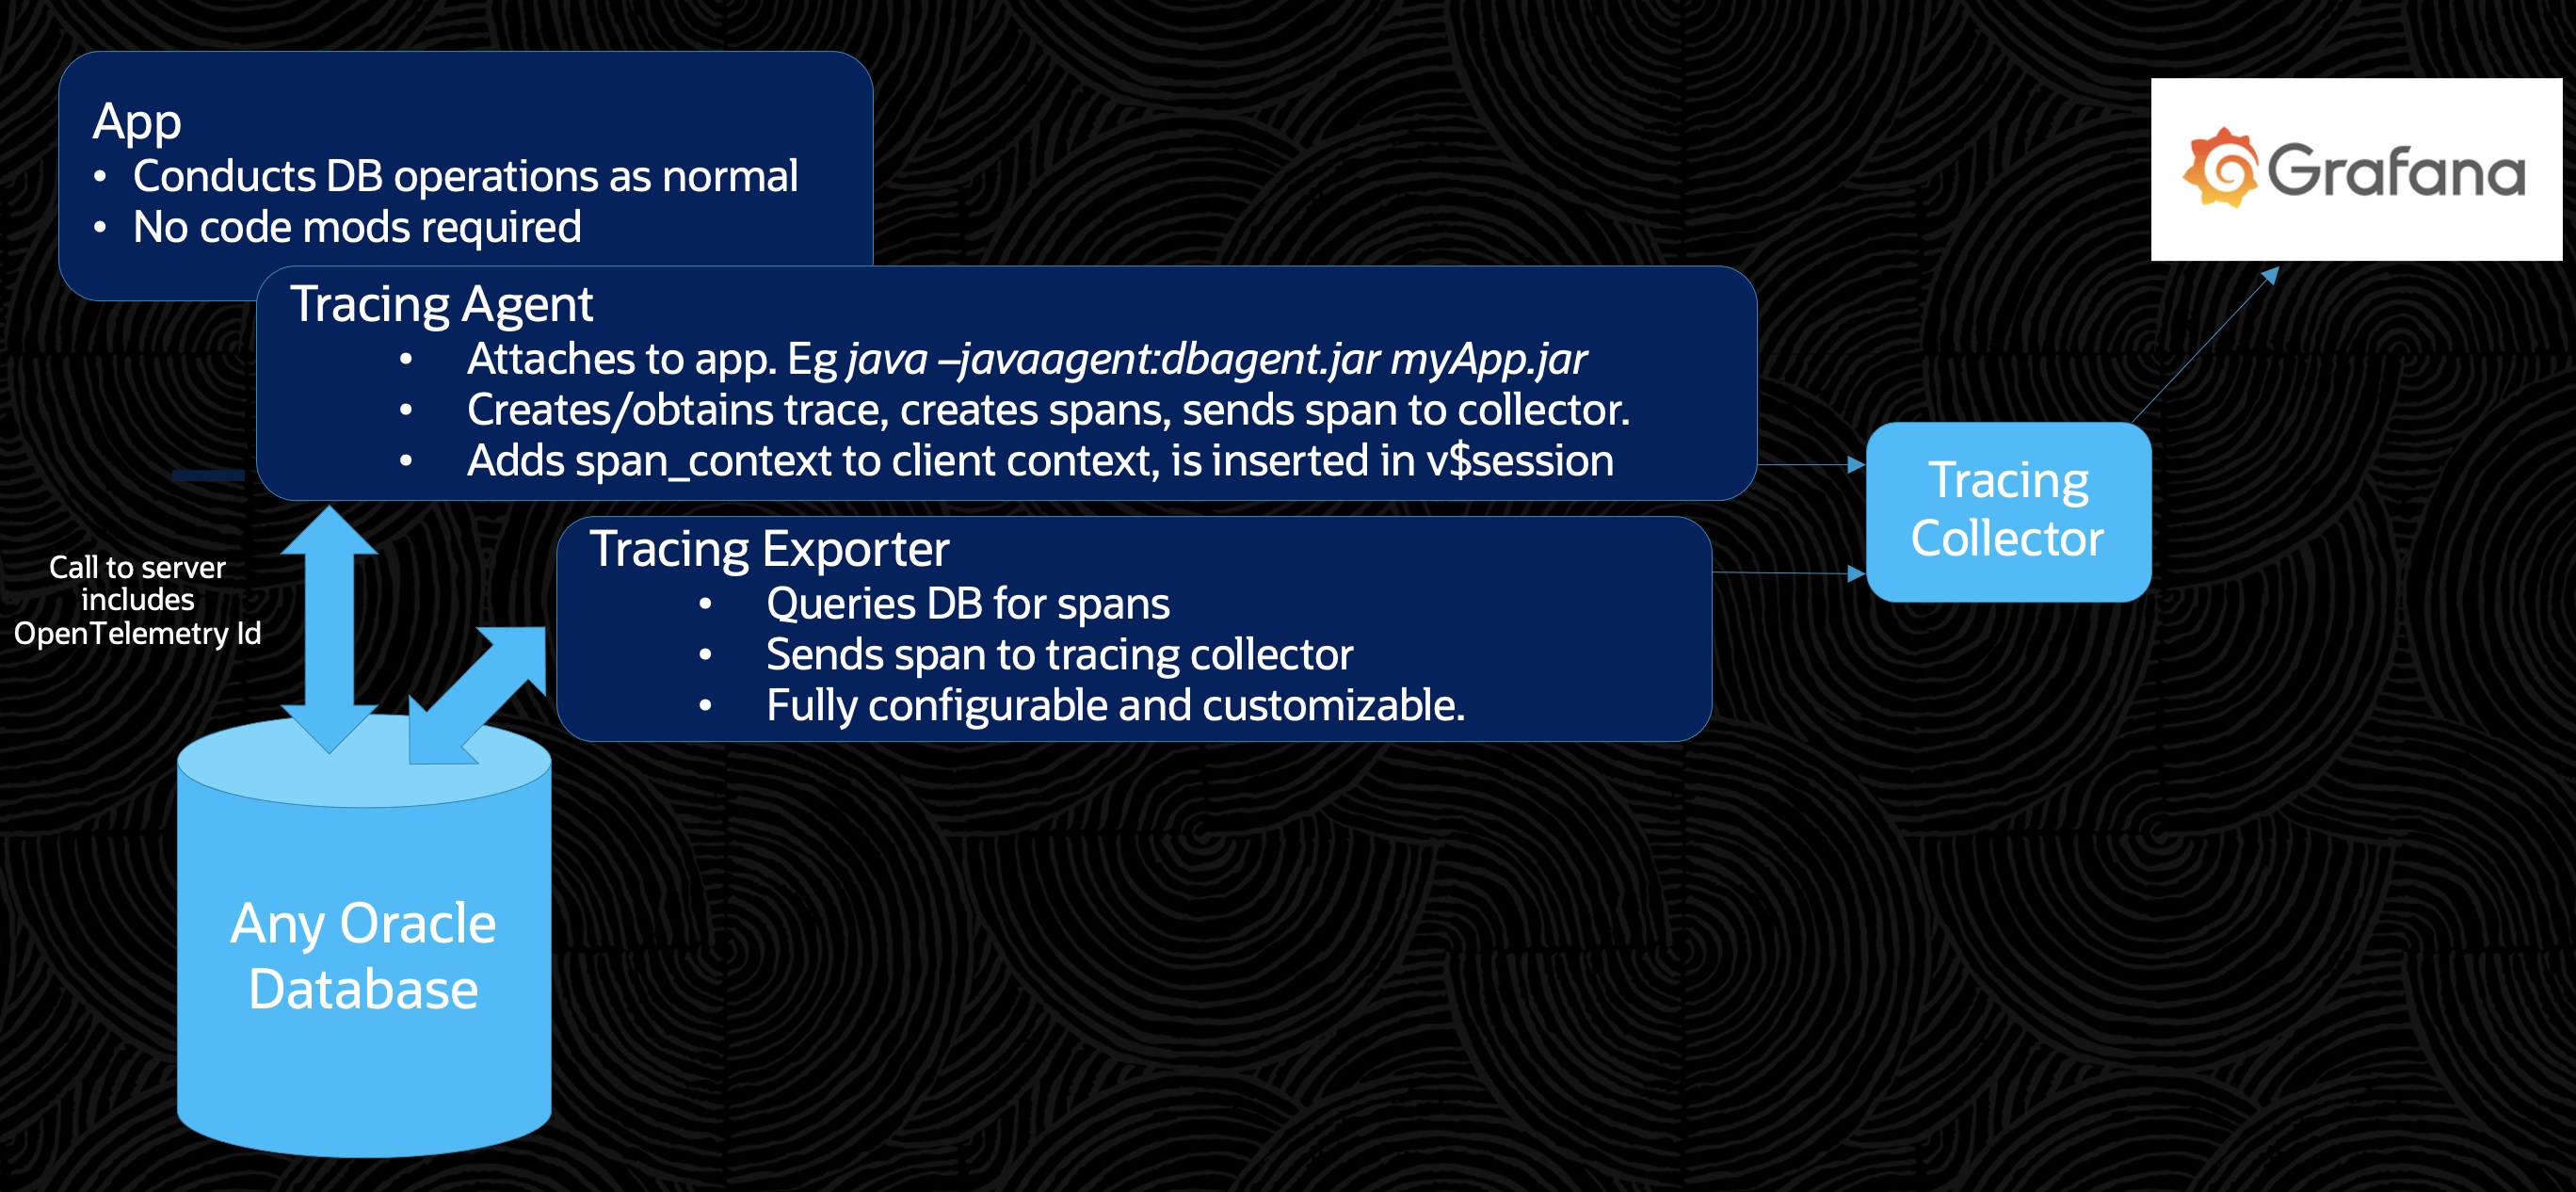
Below is an example trace where we can see the span of the microservice (deployed in Kubernetes) as well as the span of the activity within the database (notice bind values that would not be obtainable from the edge, ie outside, of the database).

Tracing Exporter

Here is an example of a simple trace query configuration. Convenience template s are also provided for more common usages (in this case we see bind values are added to the trace)
[[trace]]
context = "orderdb_tracing"
tracingdesc = { value = "Trace including sqltext with bind values of all sessions by orderuser"}
traceidfield = "ECID"
template = "ECID_BIND_VALUES"
request = "select ECID, SQL_ID from GV$ACTIVE_SESSION_HISTORY where ECID IS NOT NULL"
The following is a diagram of a more complex and realistic microservices trace flow that also involves multiple databases and messaging. Because of the AQ/TEQ messaging system in the Oracle database (see Develop With Oracle Transactional Event Queues blog) there is support to propagate the trace across not only application and database tiers but also different messaging types not typically or easily/implicitly supported even in service mesh solutions.

Observability Controller of the OraOperator (Oracle database Kubernetes Operator)
Finally, the OraOperator (Oracle database Kubernetes Operator) will soon have an observability controller that will allow you to, with a single line of configuration, enable the observability exporter on any Oracle database automatically. Simple and powerful.
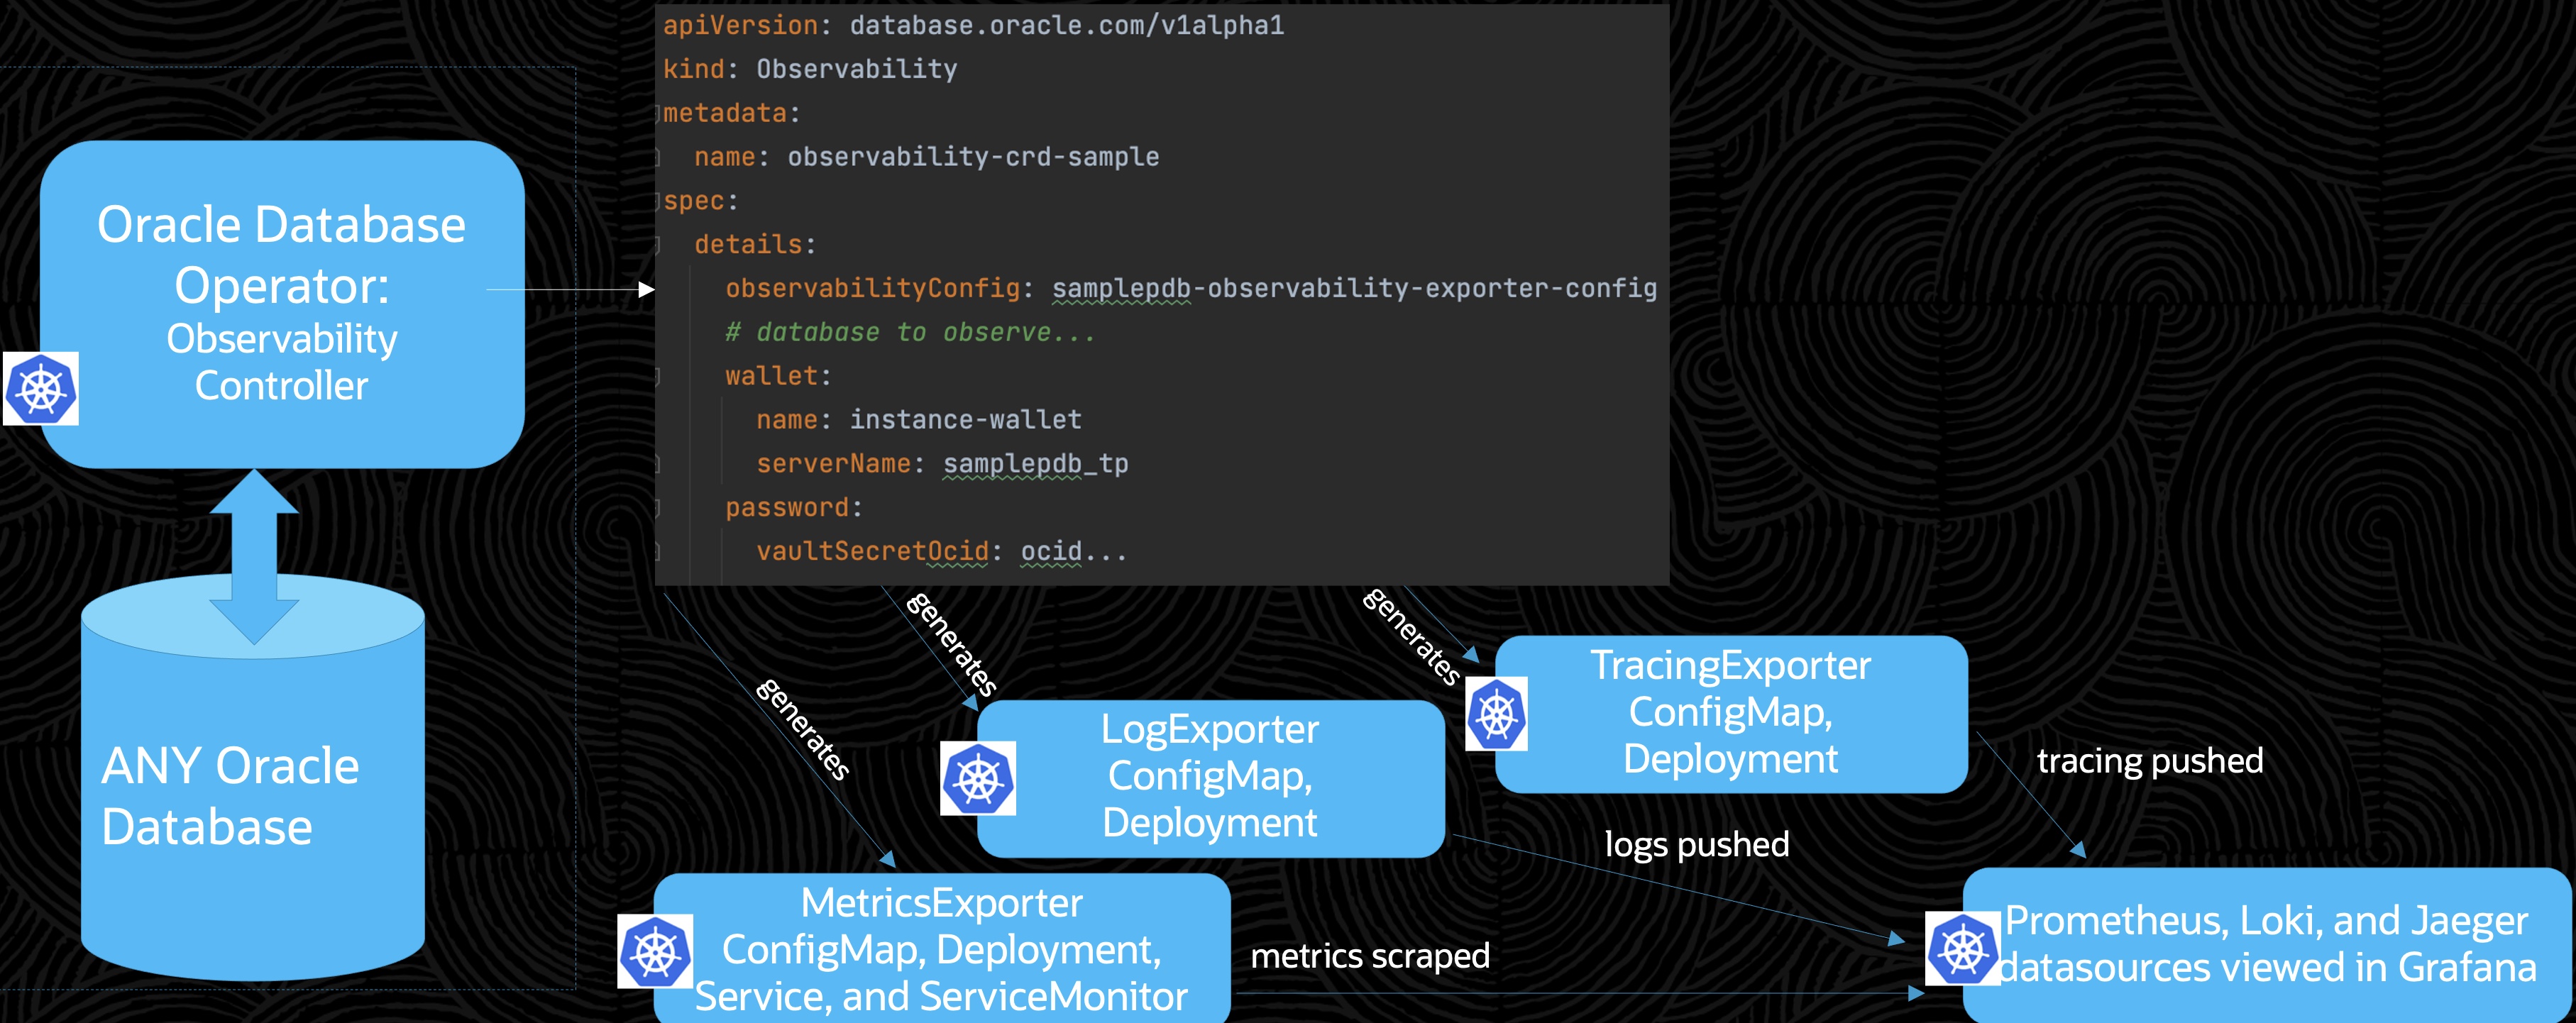
The observability exporters continue to be developed and we are always looking for any use cases or enhancements suggestions. I am happy to help and implement them. Thank you for your time reading.
Opinions expressed by DZone contributors are their own.

Comments