Data Profiling With Oracle Data Mining
Data profiling is an important step to take before processing data. Learn how to do it with Oracle Data Mining, which is easily implemented in Oracle SQL Developer.
Join the DZone community and get the full member experience.
Join For FreeIn this article, I will show you how to profile data with Oracle Data Mining.
Data profiling is a very important step in making sense of a dataset. Before we start a job, we need to know what kind of columns are in the data, what range these columns contain, what range of min/max points are involved, how many distinct values are involved, and how many null records we have before using the data that will directly influence how we analyze and use the information. For this reason, data profiling is a very important step to take before processing the data.
There are multiple methods for data profiling. As you can write your own scripts to accomplish this, it is possible to use it in built-in libraries. I will do this with Oracle Data Mining, one of the methods that I can easily implement from within Oracle SQL Developer. First, let's open the Oracle Data Mining window on Oracle SQL Developer.

We are now creating a new project and workflow through our existing ODM link.

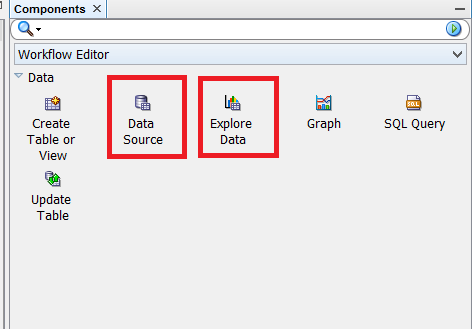
We have created our new workflow. Now, drag and drop the components we need to profile the data from the Toolbox to the workflow.

First, let's put the Data Source component in the workflow and its settings. (I will enter the datasource where the datasource component is to be profiled)

I gave the dataset to the datasource component (HR_DATA). After selecting this dataset, column and data information about this set are listed in the grid at the bottom of the window.
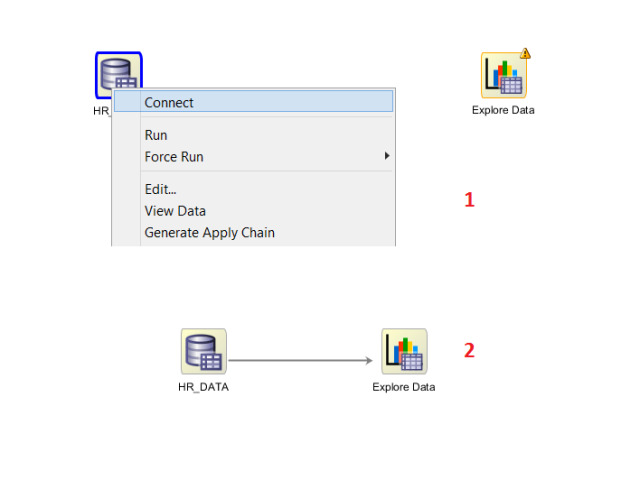
Now we will drag and drop the Explore Data component onto the workflow and connect to the Data Source component.

Now that we have our connection, let's run the workflow.
 Running the workflow may take some time, depending on the size of the data we are examining. We can follow the process through the screen. Once this is done, right-click on the Explore Data component to observe the results and call View Data.
 The result screen contains a separate line record for each column in each dataset. We can observe that some statistics and calculations are made for each column in our dataset. We can reach the following results on this screen by column.
- NULL percent
- Distinct count
- Distinct percent
- Mode value
- Average
- Average date
- Median value
- Median date
- Min value
- Max value
- Standart deviation
- Variance
- Skewness
- Kurtosis
- Histogram
In addition, data populations on the columns can be visually displayed via histograms by opening the pop-up window to the Statistics tab.

Through these histograms, we can easily observe what values are changed and how they are distributed.
As we can see from the sample we have done, we can get useful values as a result of data profiling. I will analyze these values to make my information even more beneficial.
Opinions expressed by DZone contributors are their own.

Comments