Data Mining in IoT: From Sensors to Insights
Get the data, then make use of it!
Join the DZone community and get the full member experience.
Join For FreeIn a typical enterprise use case, you always start from something small to evaluate the technology and the solution you would like to implement, a so-called “Proof Of Concept” (POC). This very first step is fundamental to understanding technology’s potential and limits, checking the project's feasibility, and estimating the possible Return on Investment (ROI).
This is exactly what we did in the use-case of a people counting solution for a university. This first project phase aimed to identify how the solution's architecture should look and what kind of data insights are relevant to provide.
Another important part of the project was to match data from the room booking system of the university with accurate occupancy data. This is fundamental to evaluate if a room is occupied for a formal or informal event and therefore understand how to optimize the university's spaces.
The IoT Architecture
The architecture described below is intended for the POC only. Still, it has been fundamental to understand how to scale the solution to a higher level of complexity by integrating more sensors in a second phase. How the enterprise-level architecture will be derived is described later within this article.
Sensors
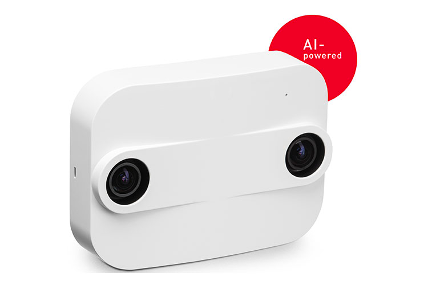
We have chosen Xovis Sensors as people counting devices. These sensors can detect people via two cameras mounted on the sensor and an AI engine directly on the device. The data is processed on edge and the devices transmit people coordinates as distinct dots only through an HTTP connection. This allows the solution to be compliant with data protection guidelines.
IoT Platform
Akenza is our IoT Low-Code Platform that seamlessly works with Xovis sensors. It allows us to integrate one of these sensors in minutes. Furthermore, Akenza provides the flexibility to scale the solution to thousands of devices if needed. This was very important for our POC as we wanted to solve the IoT part fast and cost-effectively to concentrate our efforts on the data analysis part and its scalability.
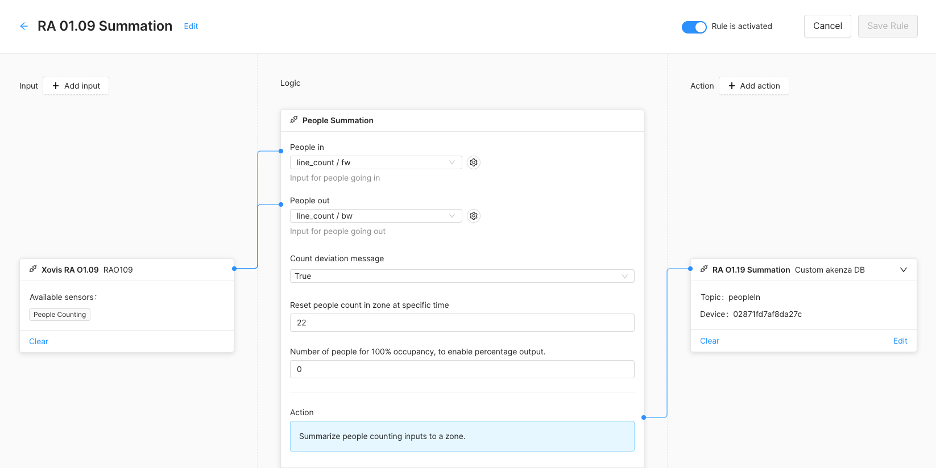
The problem with a people counting solution is that data needs to be aggregated to be correctly understood and processed on a BI solution. For that, we used a custom logic block available on Akenza’s Rule Engine. This custom logic block is a piece of JavaScript code that allows us to customize data processing directly inside Akenza.
function consume(event) {
 const deviationCount = event.properties["deviationCount"];
 const resetTime = event.properties["resetTime"];
 const maxPeople = event.properties["maxPeople"];
 let ruleState = {};

 if (event.state !== undefined) {
   ruleState = event.state;
 }

 if (ruleState.peopleIn === undefined) {
   ruleState.peopleIn = 0;
   ruleState.deviationCount = 0;
 }

 if (event.type == 'uplink') {
   const countIn = event.inputs["inCount"];
   const countOut = event.inputs["outCount"];

   const sample = {};
   ruleState.peopleIn = ruleState.peopleIn + countIn - countOut;

   if (ruleState.peopleIn < 0) {
       ruleState.peopleIn = 0;
       ruleState.deviationCount--;
   }
   sample["in"] = countIn;
   sample["out"] = countOut;
   sample.peopleIn = ruleState.peopleIn;

   if (maxPeople != 0) {
       const percent = Math.round((ruleState.peopleIn/(maxPeople / 100))/5)*5;
       sample.percent = percent;
   }
   emit('action', sample);

 } else if (event.type == 'timer') {
   let time = new Date();

   if (time.getHours() === resetTime) {
       emit('action', {"peopleIn": 0, "in": 0, "out": 0});
       if (deviationCount) {
           emit('action', {"deviationCount" : ruleState.peopleIn + ruleState.deviationCount, "peopleIn": 0, "in": 0, "out": 0});
       }
       ruleState.peopleIn = 0;
       ruleState.deviationCount = 0;
   }
 }
 emit("state", ruleState)
}
Akenza provides this component as a standard block to work with people counting solutions. So, fortunately, it wasn’t required to write any single line of code and we simply reused this logic block as a black-box into the Rule Engine.
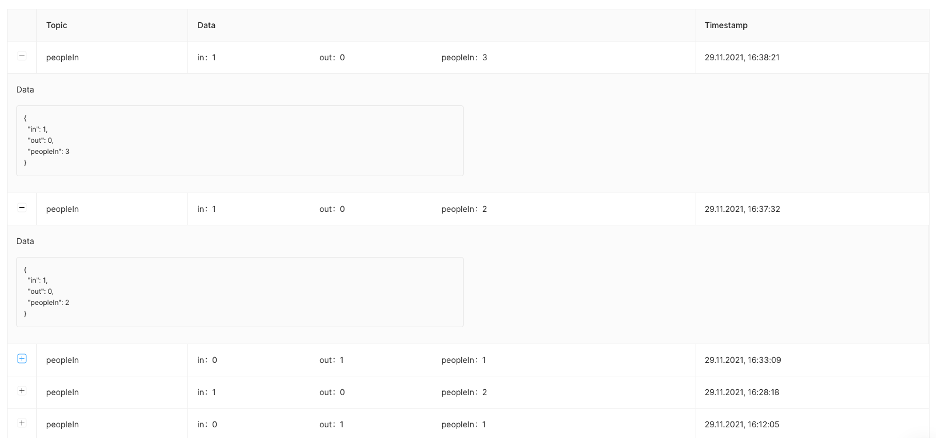
The result is a series of messages in well-formed JSON format, which reports every event (one person in/out) and aggregates the flow into an effective occupancy (number of people in the room as peopleIn).
Data Analysis Architecture
For the POC, we based our architecture on Akenza’s APIs to achieve faster results and focus on the data analysis solution. The goal was to forward the data into Power BI and display it to the end-user. To develop the Business Intelligence Solution, we worked together with Valorando, an Italian Company with vast experience in building complex data analysis solutions.
An additional requirement from the customer was to include data coming from the room booking system “Evento”, to correlate real occupancy data and booking to distinguish “formal” events (like lectures) from “informal” events like students occasionally gathering. For the POC, we downloaded an Excel file of the bookings and made it available via Sharepoint into Power BI.

Data Model
The requested solution was more than just data reporting. The aim was to develop a complete Business Intelligence application to analyze the room's occupancy and gain a thorough understanding of the facility's usage. Therefore the expertise of Valorando has been required to develop calculations to build a solid data analysis backend to support a usable and powerful frontend.
Scalability had to be taken into account in the data model as well to make it easier afterward to integrate thousands of devices without affecting any part of the logic behind it.
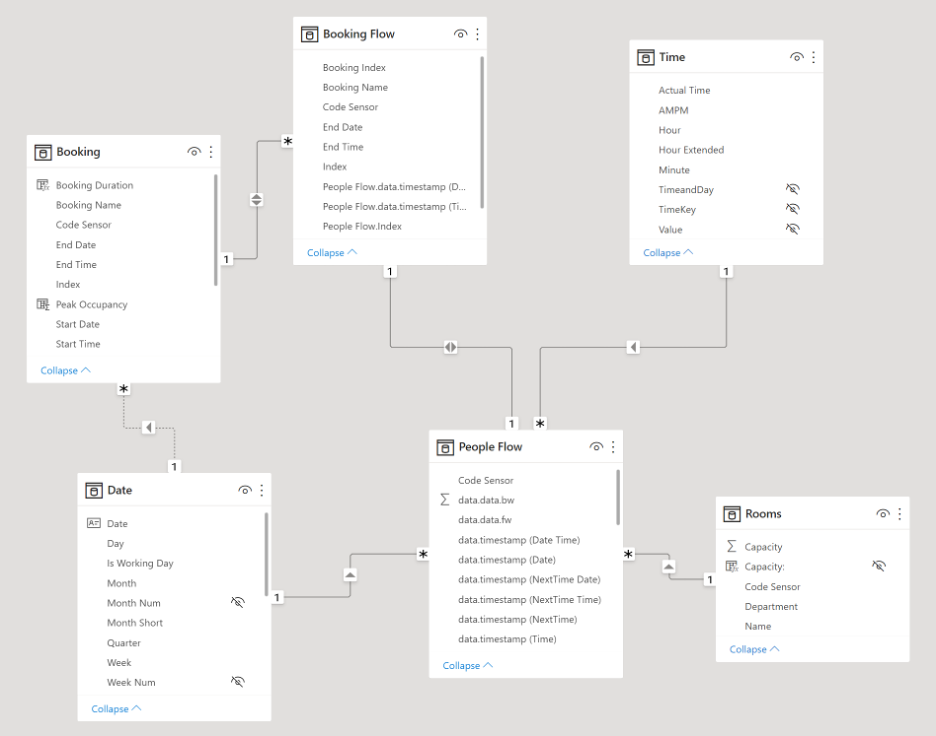
- People flow
- Is the main table in which all data from all sensors converges (tables are appended)
- Booking
- Is the table with the reservations made with the room booking software Evento
- Booking flow
- Is the correlation between people flow and booking
- Rooms
- Is the table for the hierarchy of rooms on several levels (Department, Building, etc.)
- Date - time
- Are the tables for the temporal referencing of events
DAX Data Calculations
The Data Model was not only built on table relationships, but data had to be further manipulated to achieve the desired data analysis goals.
People flow
Each time a person enters one room, Xovis sensors send an update of “+1”. This data is therefore aggregated from the rule engine of Akenza. But in order to understand the occupancy of a room we had to go a step further: what is the duration of each “occupancy-event”? This is actually the core question in order to report a percentage of occupancy during one day, month or year.
The duration of an occupancy-event is therefore the interval that occurs between the current message and the next one:
Duration = FORMAT('People Flow'[data.timestamp (NextTime)] - 'People Flow'[data.timestamp (Date Time)], "hh:mm:ss")
This provides the basis to get the duration in hours:
Duration Hours = IF('People Flow'[data.timestamp (Date)] = 'People Flow'[data.timestamp (NextTime Date)], 24*[Duration], 0)
The percentage of current occupation easily calculated in relation the room capacity:
Event Occupancy % = DIVIDE('People Flow'[PeopleIn], RELATED(Rooms[Capacity]), BLANK())
Booking
Once we easily calculated the booking duration and, therefore, which occupancy-event occurs in this interval, we had all the elements to get the most critical value for a booking: the peak occupancy.
Start Time - End Time = FORMAT(Booking[Start Time], "hh:mm") & " - " & FORMAT(Booking[End Time], "hh:mm")
Measures
In Power BI there is the possibility to define so-called “Measures”. These are actually the KPIs that are at the core of our BI Solution: measures provide the real data value, insights about room occupation to drive management decisions.
Weighted occupancy and peak occupancy
Getting the peak occupancy was not enough, the weighted form of these measures correlates the occupancy with the duration of the occupancy itself.
- Weighted Occupancy =
VAR Num = SUMX('People Flow', ('People Flow'[Event Occupancy %]) * 'People Flow'[Duration Hours])
VAR Den = SUMX('People Flow', [Duration Hours])
VAR Result = DIVIDE(Num, Den)
Return Result
- Weighted Peak Occupancy =
VAR Num = CALCULATE(SUMX('Booking', Booking[Peak Occupancy] *Booking[Booking Duration]),USERELATIONSHIP(Booking[Start Date],'Date'[Date]))
VAR Den = CALCULATE(SUMX('Booking', Booking[Booking Duration]),USERELATIONSHIP(Booking[Start Date],'Date'[Date]))
VAR Result = DIVIDE(Num, Den)
Return Result
Other important and easy to calculate measures are:
- % Occupancy
- Average event occupancy
- Average people in
- Event type
- Flow Out
- Max event occupancy
- Max people in
- Net flow
Data Visualization: Power BI Frontend
A proper frontend is needed to represent data in a useful way, making results comprehensible and allowing different levels of analysis.
- Overview
- Provides a general overview of the rooms by specifying
- Total Usage Distribution
- Usage Distribution
- Booking hours Vs peak and Average Occupancy
- No Booking Hours Vs Average Occupancy
- Provides a general overview of the rooms by specifying

- Room performance
- Provides an indication of the performance in terms of each room
- % of booked hours
- % of weighted peak occupancy
- Booking Vs No Booking hours and weighted peak occupancy for every single weekday
- Booking Vs No Booking hours per week
- Provides an indication of the performance in terms of each room

- Booking details
- Provides details of each event for each room
- % of booked hours
- % of weighted peak occupancy
- Daily detail of events
- Hourly profile - Weighted occupancy Vs Weighted peak occupancy
- Top 5 events by peak occupancy
- Worst 5 events by peak occupancy
- Provides details of each event for each room

End of POC and project scalability concept
The akenza platform ensures the scalability of the solution. Despite the significant amount of data generated, the platform can manage a large number (possibly thousands) of devices.
However, the data analysis layer requires a specific architecture to provide suitable performance for a large number of sensors and to aggregate data on a historical basis.
Customer’s Architecture
The customer's IT department is currently implementing a data warehouse on Microsoft Azure to meet the organization's current and future requirements.
Therefore, when designing the post-POC architecture, we used the capabilities of Azure to define a coherent data flow from the sensor to the BI solution.
Specifically, it is now possible for akenza users to connect an Azure IoT Hub instance as a data target. Device data from the akenza platform can quickly be processed for the Azure IoT Hub and used for any Azure products. Connecting the specific Azure IoT Hub to akenza can be carried out at the data flow level and is fully automated, enabling secure and reliable communication.
This architecture has another advantage: The data from the "Evento" booking system is also transferred to the data warehouse. This offers the possibility of comparing data directly within the database using SQL queries, with a clear advantage in terms of the solution's overall performance.
Solution Scalability Overview
In order to scale the PoC solution into a full-fledged solution, one needs to:
- Collect data from devices and save it permanently in a database
- Mashup data from devices and the event booking system
- In order to successfully scale the solution, data transformation has to take place before Power BI
- We assume that the event bookings are created, filled out, and maintained by the customer
- Refine the Power BI analytics model (dataset) to do the necessary calculations
- Create a final report package and train the end users
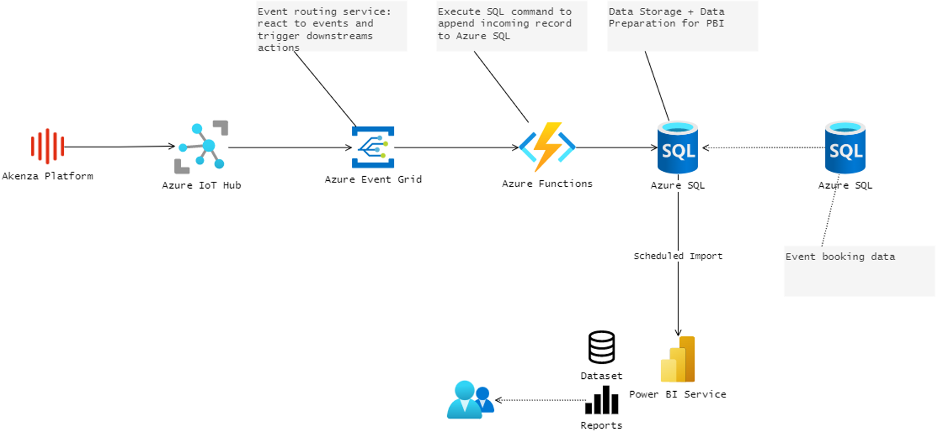
- akenza platform
- akenza - IoT platform for connection management, device configuration, and data aggregation/processing
- Connects and synchronizes with Azure IoT Hub via the standard output connector
- Azure IoT Hub
- Entry point for IoT devices in Microsoft Azure
- Azure Event Grid
- Event Routing Service: react to events and trigger subsequent actions
- Azure Functions
- Execute SQL commands to append incoming records to Azure SQL
- Azure SQL
- Data storage and data preparation for PowerBI
- Azure SQL - Evento
- We assume that the event bookings are created, filled out, and maintained by the customer
- Power BI Service
- The same file visualization solution developed for the POC
This proof of concept allowed validating the current system architecture and generating the first insights on the usage of the rooms for the university. Over the following months, the project will be scaled to numerous sites and adapted to a large device fleet.
This use-case clearly shows how an IoT solution is much more than connected devices and data visualization. Furthermore, one of the key takeaways from this case study is that POCs should always be conceptualized taking into account the scalability of the project and its final marketability.
Opinions expressed by DZone contributors are their own.

Comments