JaCoCo End-to-End Code Coverage at Runtime
Maintain code coverage from start to finish with this open source tool and a sample Spring Boot application to play with.
Join the DZone community and get the full member experience.
Join For Free
This article demonstrates how to generate coverage for integration/runtime tests using the JaCoCo agent that is based solely on runtime/integration tests. There are many articles on the Internet that explain code coverage using the Jacoco Maven plugin. The best part of this article is no use of any Maven plugin or unit tests (jUnit tests) to produce coverage reports.
JaCoCo is a free code coverage library for Java created by EclEmma.
You may also enjoy: Verifying End-to-End Test Code Coverage Using Jacoco Agent
Before we move on to look at the code coverage capabilities of JaCoCo, we should have a look at the code sample. I have developed the simplest application based on the Spring Boot framework. The code for this application can be found at Github account.
@RestController
public class SampleController {

@GetMapping(path = "/test/{param}")
public String codeCoverageMethod(@PathVariable int param) {

if (param > 10) {
return callingThisMethod(param);
}
else {
return callingAnotherMethod(param);
}
}

private String callingThisMethod(int param) {

System.out.println("Calling this method.");
if (param < 10) {
System.out.println("This code cannot be called..");
}
return "Calling this method.";
}

private String callingAnotherMethod(int param) {

System.out.println("Calling another method.");
return "Calling another method.";
}

}
Report Generation
1. We should pass javaagent as a VM argument while running the application.
- Command-line:
java -javaagent:<path-to-application>/src/main/resources/lib/jacocoagent.jar=address=*,port=36320,destfile=jacoco-it.exec,output=tcpserver -jar <path-to-application>/target/jacoco-code-coverage-example-0.0.1-SNAPSHOT.jar- For STS, we can configure it under Argument section and put below VM argument:
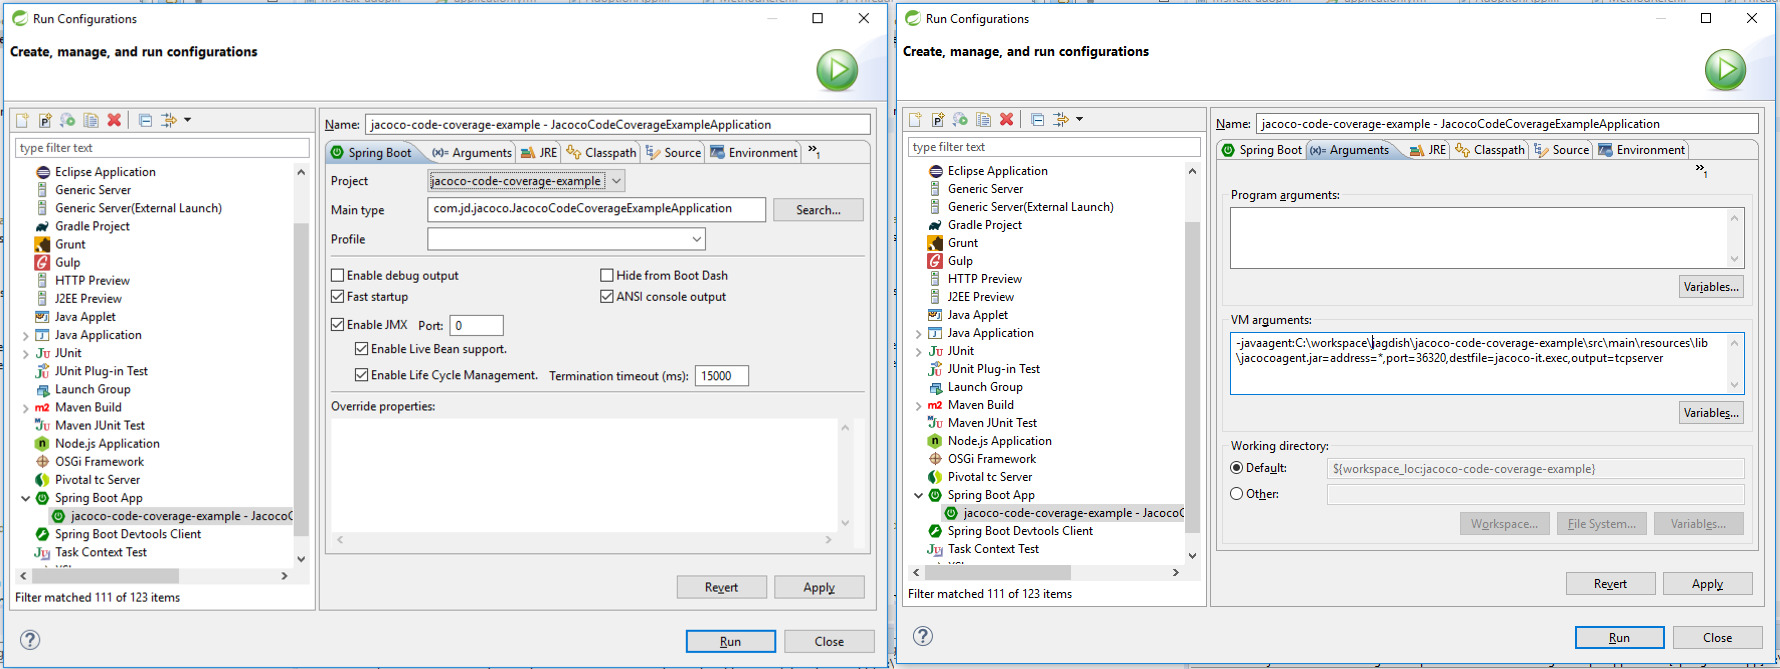
-javaagent:<path-to-application>/src/main/resources/lib/jacocoagent.jar=address=*,port=36320,destfile=jacoco-it.exec,output=tcpserverTo run it in the STS, right-click on the project and run it as a Spring Boot application and add all configurations. We can refer to the pictures below for this.

We have given the port and destfile as input to javaagent. Javaagent will dump all data (generated through the report) into the destfile and it is located on the given port of the server.
2. Now we will hit rest endpoints to check the code coverage. We can do this using browser/postman or curl command as shown below in the shell script.
curl -X GET http://localhost:8080/test/9
curl -X GET http://localhost:8080/test/50
3. Therefore, we have hit the rest of the endpoints. Now we are about to dump the file, which will be in exec format. This code will be all data collected from javaagent to analyze the code coverage. We will use this command to dump the report and the dump file will be inside the target folder.
java -jar <path-to-application>/src/main/resources/lib/jacococli.jar dump --address localhost --port 36320 --destfile <path-to-application>/target/jacoco-it.exec4. We have collected the data, but it is not in a readable format. We can use the command to generate code coverage reports readable in many formats, including HTML, CSV, and XML. I am converting to HTML format here, so we will use the below command to create the final report.
java -jar <path-to-application>/src/main/resources/lib/jacococli.jar report <path-to-application>/target/jacoco-it.exec --classfiles <path-to-application>/target/classes/com --sourcefiles <path-to-application>/src/main/java/ --html <path-to-application>/target/jacoco-report To run all the above steps, I have created a shell script file that will automate all the steps:
mvn clean install
sleep 5
java -javaagent:src/main/resources/lib/jacocoagent.jar=address=*,port=36320,destfile=jacoco-it.exec,output=tcpserver -jar target/jacoco-code-coverage-example-0.0.1-SNAPSHOT.jar
sleep 5
curl -X GET http://localhost:8080/test/9
curl -X GET http://localhost:8080/test/50
sleep 5
java -jar src/main/resources/lib/jacococli.jar dump --address localhost --port 36320 --destfile target/jacoco-it.exec
sleep 5
java -jar src/main/resources/lib/jacococli.jar report target/jacoco-it.exec --classfiles target/classes/com --sourcefiles src/main/java/ --html target/jacoco-report
Note: To run the above script, the terminal must indicate the current location as the location of the project directory.
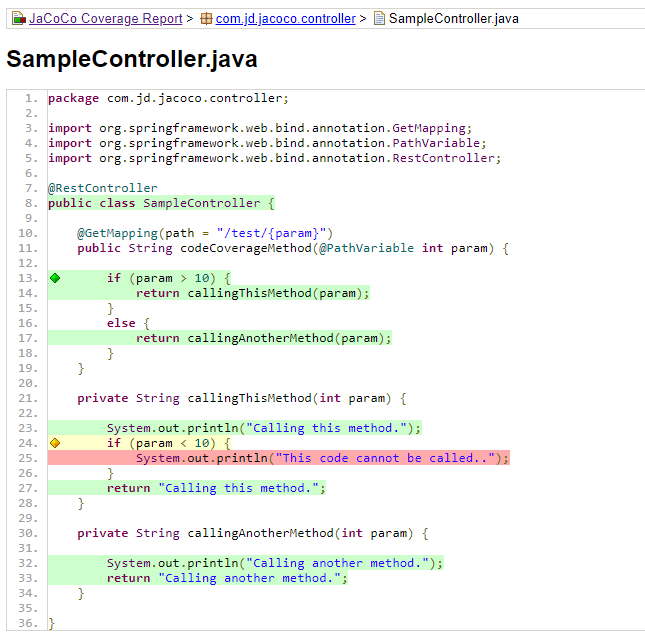
The code coverage report is ready. Now we can take a look at the target/jacoco-reports/index.html page to see what the generated report looks like.
Report Analysis
As we can see in the report, it shows 93% instructions coverage, 75% branches coverage.


If we look at the reports generated, we can see some color and shape in the report. The JaCoCo report helps us analyze code coverage by using diamonds with colors for branches and background colors for lines:
The red diamond indicates that no branch has been executed during the execution of the code.
The yellow diamond shows that the code is partially covered; some branches have not been executed.
The green diamond represents that all branches have been executed during the execution of the code.
We can refer to the same color code for the background color, but this is for the coverage of the lines.
Source Code
The source code for this post can be found on Github account.
Opinions expressed by DZone contributors are their own.

Comments