How to Cluster Images With the K-Means Algorithm
Learn how to read an image and cluster different regions of the image using the k-means algorithm and the SciPy library.
Join the DZone community and get the full member experience.
Join For FreeIn this article, we will explore a method to read an image and cluster different regions of the image. Image segmentation is an essential topic in an image processing framework. It is the process to classify an image into different groups. There are many different methods, and k-means is one of the most popular methods.
In this exercise, we will utilize the SciPy library to read the image as presented in the below code snippet.
%matplotlib inline
import matplotlib.pyplot as plt
from scipy import ndimage
from sklearn import cluster
image = ndimage.imread("sibanjan.jpg")
plt.figure(figsize = (15,8))
plt.imshow(image)
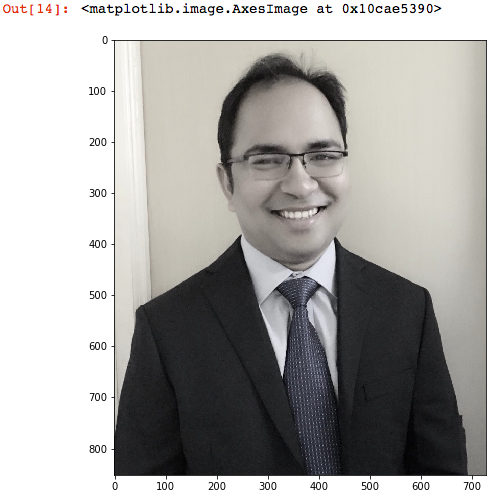
After we import the image, we print it on the screen to validate whether it was successfully uploaded. I uploaded my photograph. It is not the best one that I have, but it was something that I found it quickly on my desktop.

Next, we examine the dimensions of the image. As we can see, it is a three-dimensional array.
image.shape 
For clustering the image, we need to convert it into a two-dimensional array with the length being the 852*728 and width (3) as the RGB value.
x, y, z = image.shape
image_2d = image.reshape(x*y, z)
image_2d.shape
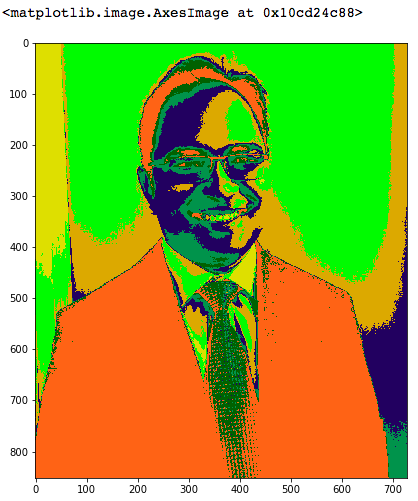
Next, we use scikit-learn's cluster method to create clusters. We pass n_clusters as 7 to form seven clusters. The clusters appear in the resulting image, dividing it into five parts with distinct colors. The number 7 was chosen heuristically for this demonstration. One can change the number of clusters to visually validate image with different colors and decide that closely matches the required number of clusters.
kmeans_cluster = cluster.KMeans(n_clusters=7)
kmeans_cluster.fit(image_2d)
cluster_centers = kmeans_cluster.cluster_centers_
cluster_labels = kmeans_cluster.labels_
Once the clusters are formed, we can recreate the image with the cluster centers and labels to display the image with grouped patterns.
plt.figure(figsize = (15,8))
plt.imshow(cluster_centers[cluster_labels].reshape(x, y, z))
We can view from the above plot that the image is grouped into seven different regions based on the image density.
That's all for this piece! You can pull the code from my GitHub account.
Opinions expressed by DZone contributors are their own.

Comments