How to Build a Word Cloud With R
When building word clouds with R, it's most important to set random.order to false so that the words with the highest frequency are plotted first.
Join the DZone community and get the full member experience.
Join For FreeIn this article, we are going to see how to build a word cloud with R. Word cloud is a text mining technique that allows us to highlight the most frequently used keywords in paragraphs of text. This technique is sometimes referred to as text clouds or tag clouds, which is a visual representation of text data.
First, we need to load the CSV data and then load the required library for building the word cloud.
##Install Packages
install.packages("tm")  # for text mining
install.packages("SnowballC") # for text stemming
install.packages("wordcloud") # word-cloud generator
install.packages("RColorBrewer") # color palettes

##Load Require Library

library(tm)
library(SnowballC)
library(RColorBrewer)
library(wordcloud)

##Read the Data

tweetsDS<-read.csv("Tweets.csv")
tweetsDS<-data.frame(tweetsDS)
Now, we need to create the corpus of data.
## Calculate Corpus
tweetsDS.Corpus<-Corpus(VectorSource(tweetsDS$content))
We need to clean the data. This includes removing stopwords, numbers, whitespace, etc. and converting the corpus into a plain text document.
##Data Cleaning and Wrangling

tweetsDS.Clean<-tm_map(tweetsDS.Corpus, PlainTextDocument
tweetsDS.Clean<-tm_map(tweetsDS.Corpus,tolower)
tweetsDS.Clean<-tm_map(tweetsDS.Clean,removeNumbers)
tweetsDS.Clean<-tm_map(tweetsDS.Clean,removeWords,stopwords("english"))
tweetsDS.Clean<-tm_map(tweetsDS.Clean,removePunctuation)
tweetsDS.Clean<-tm_map(tweetsDS.Clean,stripWhitespace)
tweetsDS.Clean<-tm_map(tweetsDS.Clean,stemDocument)
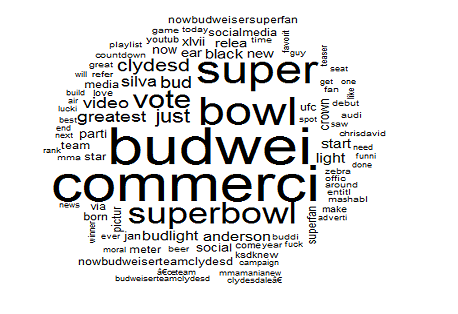
Now, we are going to plot the word cloud.
wordcloud(tweetsDS.Clean,max.words = 200,random.color = TRUE,random.order=FALSE)
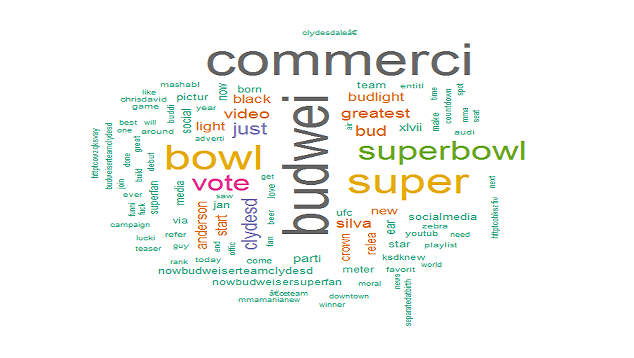
For an attractive and colorful word cloud, use the below code.
wordcloud(words = tweetsDS.Clean, min.freq = 1,
          max.words=100, random.order=FALSE, rot.per=0.35,
          colors=brewer.pal(8, "Dark2"))
Here are a couple of important definitions.
- scale: Indicates the range of sizes of the words.
- max.words: Plots the specified number of words and discard least frequent terms.]
- min.freq: Discards all terms whose frequency is below the specified value.
- random.order: By setting this to false, we make it so that the words with the highest frequency are plotted first. If we don’t set this, it will plot the words in a random order and the highest frequency words may not necessarily appear in the center.
- rot.per: Determines the fraction of words that are plotted vertically.
- colors: The default value is black. If you want to use different colors based on frequency, you can specify a vector of colors or use one of the pre-defined color palettes.
I hope you have enjoyed learning how to build word cloud with R.
Opinions expressed by DZone contributors are their own.

Comments