Automatic Failover and Failback for Legacy Multi-Port Application on AWS Cloud
Customers want to have active-failover for their monolithic applications running on multiple ports which do not support load balancers.
Join the DZone community and get the full member experience.
Join For FreeCustomers migrate their legacy applications to the cloud and want to use cloud-native services to improve their application availability. Customers want to have active-failover for their monolithic applications running on multiple ports which do not support load balancers.
This article shows a way to build a low-cost active-failover for monolithic, multi-port internal applications using Route53 and CloudWatch. This is only for an application running on multiple ports that wants to failover if any one of the ports goes down.
Prerequisites
- An AWS account with console access with full permissions on Route53 and CloudWatch and EC2.
- Route53 private hosted zone and health check
- CloudWatch metrics
- Linux EC2 instances
Understanding Overall Design
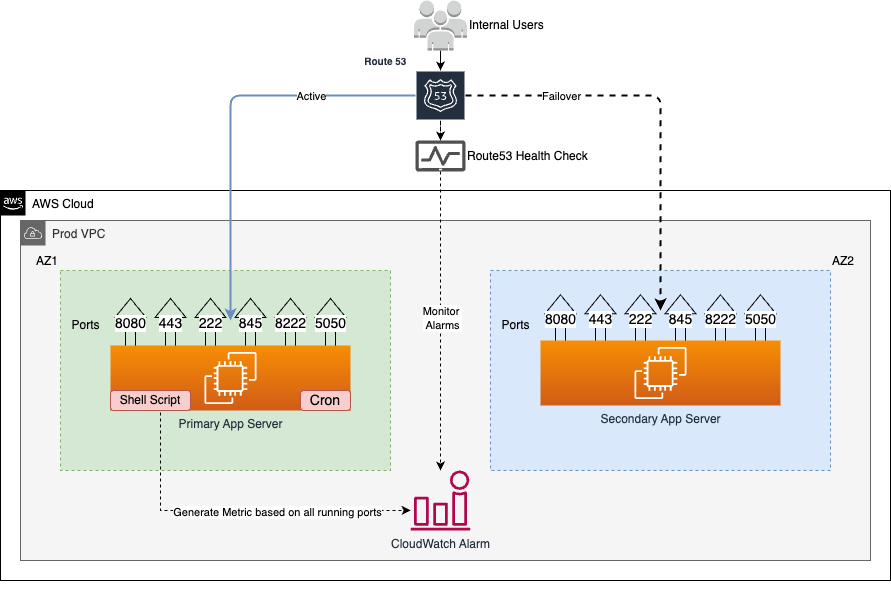
- Internal users connect to the legacy application running on AWS cloud.
- The application has been configured in a way to send all traffic to only primary server.
- One small lightweight shell script monitors all running ports inside the primary server and updates CloudWatch metrics.
- If any one of the ports goes down, a CloudWatch alarm will be triggered and Route53 will re-route all traffic to a secondary server within the next five minutes.
- Once the primary server start working again, Route53 will route all traffic back to the primary server.

Server and Simple Shell Script
Create IAM Role to Update the CloudWatch Metrics
- The primary server must have permission to update CloudWatch to generate the metrics.
- You may need at least following permissions.
- Assign this role to your servers.
{

    "Version": "2012-10-17",

    "Statement": [

        {

            "Sid": "VisualEditor0",

            "Effect": "Allow",

            "Action": "cloudwatch:PutMetricData",

            "Resource": "*"

        }

    ]

}
Put the following shell script in root user crontab in the server.
Change the instance ID and ports according to your configuration in the script.
#!/bin/bash

for port in "22" "25" "8080" "80"

do

lsof -i:"$port"  -P | grep IPv4  | grep LISTEN > /dev/null

if [ $? -eq 1 ]; then

   echo "$port is not listening"

   exit

fi

done

aws cloudwatch put-metric-data --metric-name Drives-health --dimensions Instance=i-066111111111100a66 --namespace "Custom" --value 1 --profile <default>
CloudWatch Alarm Configuration
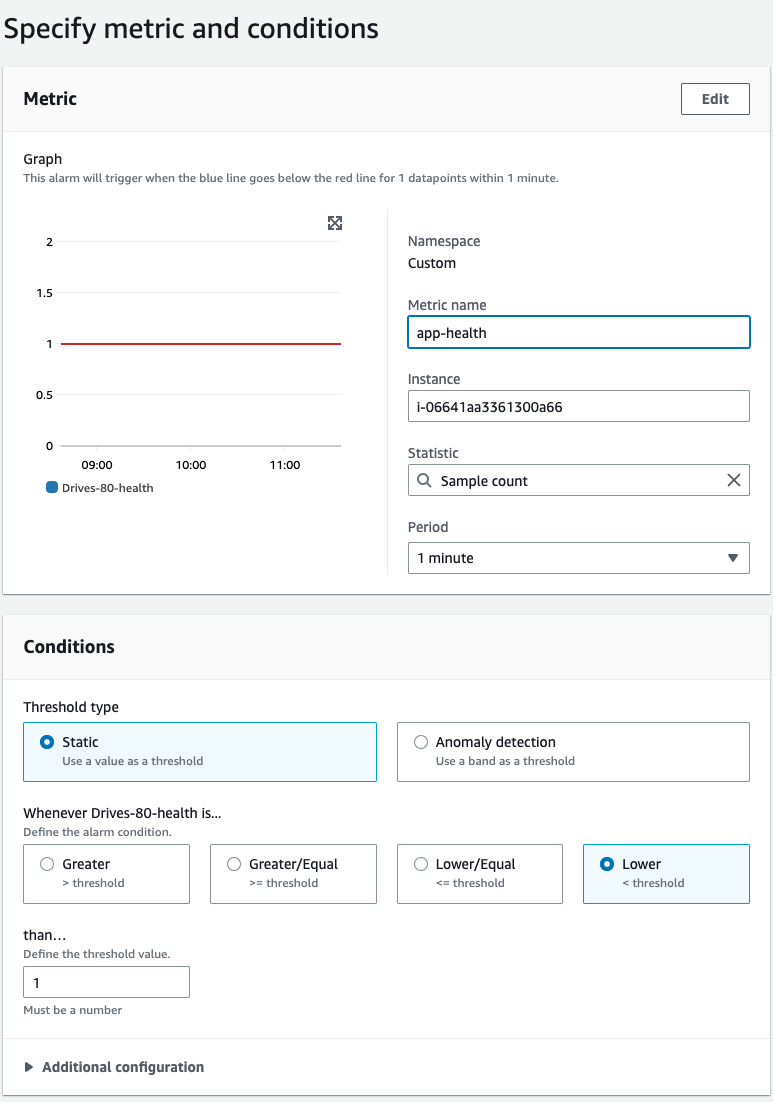
- The shell script will send a health check in form of binary value "1" to CloudWatch.
- CloudWatch will generate metrics based on health-check data.
- Configure a CloudWatch alarm with the following conditions and send a notification to your desired SNS topic.

Route53 and Health Checks
Route53 Health Checks
- Create Route53 health check.
- Select "state of monitoring alarm."
- Select CloudWatch alarm created in previous step.
- Route53 will monitor CloudWatch alarm with this health-check service.
Route53 DNS Records
- Create a record for your application with failover routing policy.
- While creating primary failover record type, make sure to select the health check ID created in the previous step.
- Do not select any health check ID while creating failover record type.

Testing
- Access a record URL from your browser and check the server receiving the incoming requests.
- Stop any one of the port on primary server, wait for a minimum of five minutes and access the URL again.
- All requests should route to secondary server.
- You can failback to the primary server by starting the stopped port.
Summary
This pattern is for legacy monolithic applications that do not support a load balancer and running on multiple ports. I have given a very simple method to set up an application which can easily failover within five minutes without any AWS load balancer.
Opinions expressed by DZone contributors are their own.

Comments