Alternatives to Handsontable and ag-Grid
This article reviews JavaScript UI libraries that can be considered alternatives to ag-Grid and Handsontable to integrate grids and spreadsheets into web apps.
Join the DZone community and get the full member experience.
Join For FreeIn any industry, big brand names certainly affect the customer purchase decision, and web development is not an exception. As a vivid example, we can mention such an important aspect of any business app as data management. A web developer who needs a proper JavaScript library for this purpose may be tempted to choose time-tested ag-Grid and Handsontable components and save themselves the trouble of the time-consuming search. These tools are really useful for implementing JavaScript data tables and spreadsheets. But why limit yourself to only a couple of trendy products when there are so many alternatives on the market?
In this article, I’ve put together JavaScript tools from well-known vendors that can be used instead of Handsontable and ag-Grid for integrating both grids and spreadsheets (as well as other useful functionalities such as a pivot table) into web apps based on popular frameworks.
DHTMLX JavaScript Components
DHTMLX is a provider of JavaScript components for covering the diverse needs of modern business apps. The DHTMLX product line includes several components for data processing.
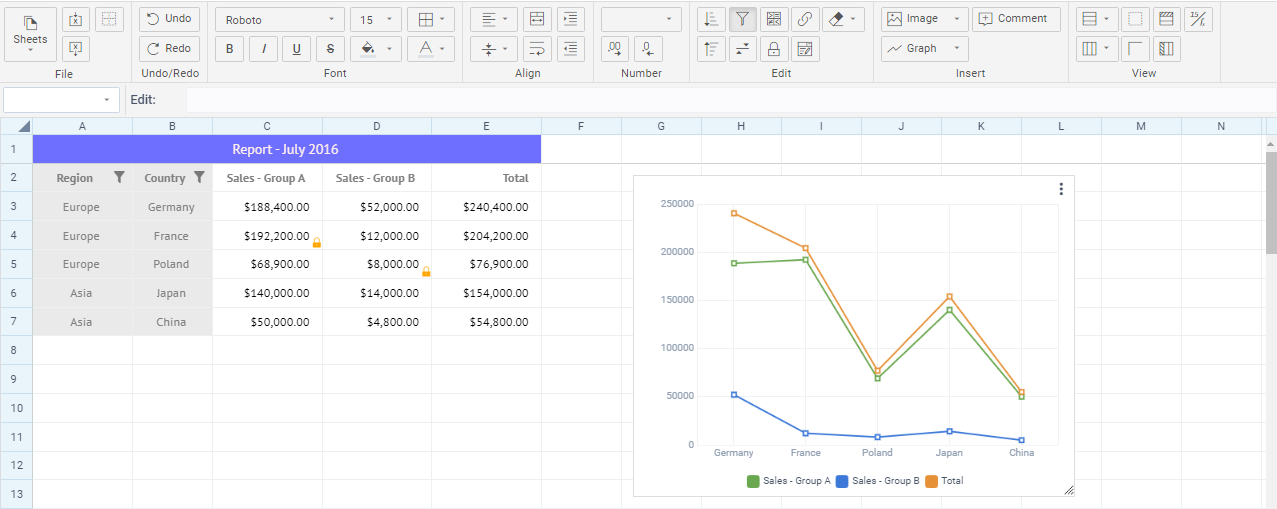
With the JavaScript spreadsheet component at your fingertips, you get the instruments required for arranging large datasets in a tabular form and analyzing the info. Delivering Excel-like experiences into your app becomes easier thanks to the availability of the following features:
- Numerous options for searching, sorting, and filtering data,
- Text formatting options: text decoration, color, and alignment, background color (lacks in Handsontable),
- Operations with rows and columns (add/remove, freeze, resizing, auto-width),
- Possibilities for working with cells (merging cells, adding drop-down lists, locking/unlocking cells, inserting links, auto-filling, and multiline content),
- A pack of predefined functions and formulas (250+) that are fully compatible with Google and Excel Sheets,
- The ability to simultaneously work with multiple sheets and cross-reference between them (lacks in Handsontable),
- Number formats (common, text, number, date, percent, currency, and custom formats),
- Spreadsheet navigation with keyboard hotkeys.

Unlike Handsontable, this component allows enabling the built-in toolbar with Spreadsheet controls as well as adjusting it to your needs.
On top of that, DHTMLX Spreadsheet offers you opportunities to change the appearance, structure, and functional capabilities of core spreadsheet elements. For instance, it is possible to add your own controls and icons to the toolbar, context menu items, and read-only mode.
Free trial version: DHTMLX Spreadsheet
Price: from $599
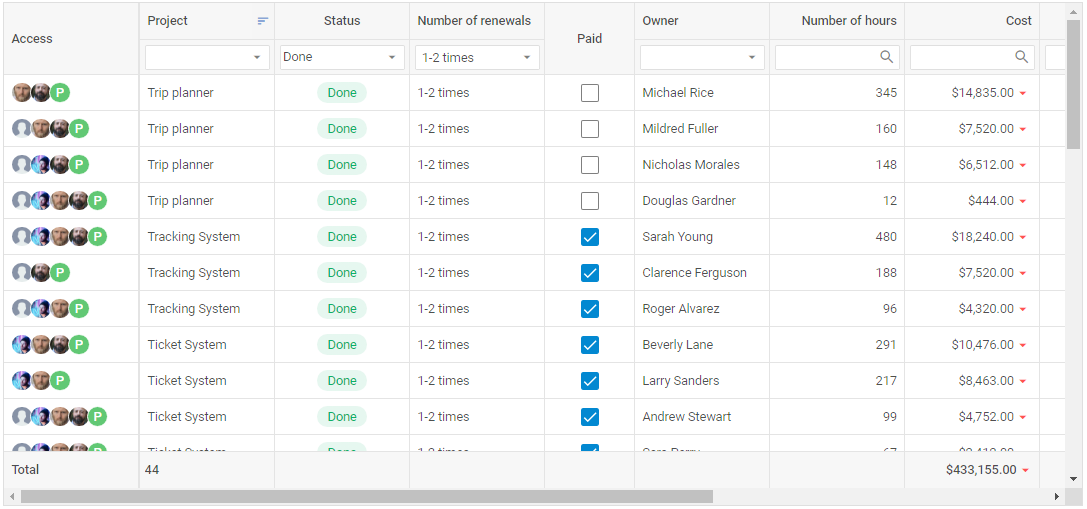
In case you need to embed a customizable and configurable data table with ample editing options into your app, take a look at DHTMLX Grid and benefit from its top features:
- Reordering of rows and columns with drag-and-drop,
- Sorting and filtering,
- Built-in column editors,
- Resizable columns,
- Multiple cell selection,
- Specifying cell value formats,
- Multiline headers and footers,
- Templates for cell’s content and tooltips,
- And more.

Free trial version: DHTMLX Grid
Price: from $339
All these DHTMLX components also support many features contributing to a better experience with DHTMLX. They are high-performance with large amounts of data, TypeScript definitions, UI localization, and export to Excel and CSV formats.
Using detailed documentation with step-by-step guides, live samples, and demos, you won’t need much time to get started with the DHTMLX products and make the most of their capabilities.
You can also get acquainted with DHTMLX components and their features in more detail via the DHTMLX code snippet tool.
My opinion: DHTMLX Spreadsheet provides end-users with more Excel-like features than Handsontable, such as toolbar controls, text decoration, export to Excel, and cross-referencing. DHTMLX Grid, as a standalone widget, offers basic data table functionality but makes room for flexible configuration and customization. All in all, DHTMLX covers a lot of developers' needs with their line of JS widgets.
Webix Widgets
Webix is one more brand specializing in the production of JavaScript widgets for implementing various functionalities in web apps. The list of available data widgets also includes possible alternatives to ag-Grid and Handsontable, namely - DataTable and Spreadsheet.
The DataTable (or DataGrid) widget provides a programming model for organizing information in rows and columns. Here is what you can expect from Webix DataTable:
- Operations with data (editing, sorting, filtering, copy-pasting, seven selection modes, etc.),
- Storing data as math formulas (lacks in ag-Grid),
- Drag-and-drop manipulations with the table (including custom drag-and-drop modes),
- Several linkable tables on a page,
- Data validation (lacks in ag-Grid),
- Export to PDF (lacks in ag-Grid) or Excel,
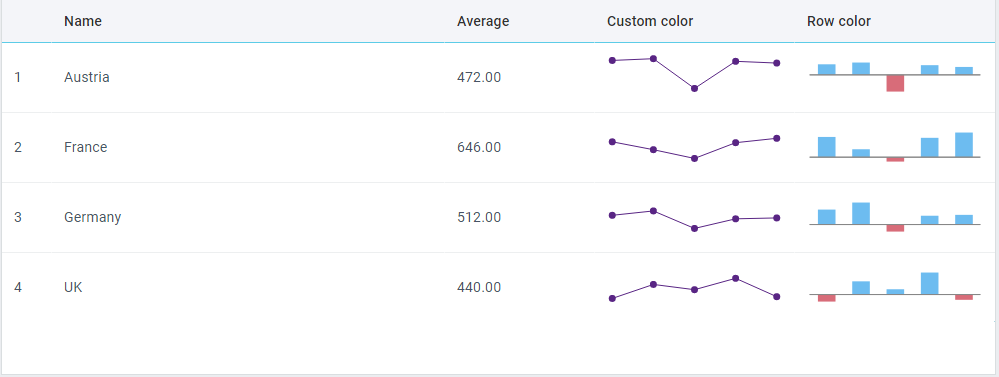
- Advanced capabilities (area selection, rowspan, colspan, grid grouping, vertical headers, sparklines, etc.).

Free trial version: Webix UI library
Price: from $848 (for a full package of UI widgets)
Webix Spreadsheet is an Excel-inspired JavaScript widget used to simplify the incorporation of multifunctional worksheets directly in the browser. The completed spreadsheet can offer the following:
- Sorting, filtering, and conditional formatting,
- Operations with sheets (adding/hiding/showing sheets, hiding/showing headers, and gridlines, etc.),
- Manipulations with rows and columns,
- Built-in (200+) and custom math functions,
- Various types of cell content (sparklines, images, comments, placeholders, etc.),
- Customizable views above cells (images, charts),
- Export in PDF/PNG, Excel (lacks in Handsontable)
- Number formatting options.

Free trial version: Webix Spreadsheet
Price: from $798
According to the company’s website, DataTable and Spreadsheet widgets are considered to be the top requested tools of the Webix library. There is no shortage of ways to customize them in accordance with your project requirements. Moreover, Webix provides several useful free tools to simplify your work with the UI widgets: UI designer, Form Builder, Code Snippet, Skin Builder, and Webix Jet.
The Webix online documentation and interactive tutorials give a clear idea of how to use these UI widgets in your project.
My opinion: I don’t have any serious arguments against using Webix DataTable and Spreadsheet for data management. Both widgets are well-documented and have decent feature sets. Here you get wider data exporting opportunities than in ag-Grid and Handsontable. However, it should be mentioned that you cannot purchase DataTable (unlike Spreadsheet) separately from other Webix widgets.
Syncfusion Essential JS 2
Syncfusion Essential JS 2 is a JavaScript toolkit comprising a range of modular and touch-friendly UI controls for achieving various web development goals. And, of course, it would not be complete without Grid and Spreadsheet controls.
Syncfusion Grid is designed for depicting data in a tabular format. Using this control, you can create grid structures and complement them with:
- Editing and record selection modes,
- CRUD operations,
- On-demand paging mode,
- A master-detail grid (lacks in ag-Grid),
- Predefined filtering and grouping capabilities,
- Templates for creating custom experiences,
- Export to PDF (lacks in ag-Grid) and Excel.
Syncfusion Spreadsheet gives a way to keep a record of different kinds of data and perform various operations for its analysis. If you decide to make this control a part of your web application, you’ll be able to benefit from:
- Reorganizing the view of data with sorting and filtering,
- Formatting options for numbers and cells,
- Built-in formulas with auto recalculation support,
- Interactivity features (undo/redo, context menu, copy to clipboard, resize and autofit, find and replace (lacks in Handsontable)),
- An interactive ribbon UI,
- Collaborative editing (lacks in Handsontable),
- Extra sources of info in the spreadsheet (charts, images, hyperlinks).
Both Syncfusion controls use row and column virtualization for ensuring a decent performance with large amounts of data. There are five built-in themes that can be customized with the Theme Studio tool for creating a unique look for your grid or spreadsheet. Exporting is available in Excel, PDF (only for the Grid control), and CSV formats.
If you decide to use Syncfusion in your app, the documentation section offers useful recommendations on the practical implementation of these data management controls.
Free trial version: Essential JS 2
Price: from $995 (for a full package of components included in the Essential JS 2 library)
My opinion: Syncfusion Grid and Spreadsheet are slightly less functional than ag-Grid and Handsontable but provide some unique features like a master detail section and collaborative editing. Unfortunately, there are no individual pricing options for these tools. But if you also require some other UI elements for your web project, such as charts, file viewers, calendars, etc., Syncfusion may be a worthy option.
Ignite UI components
Ignite UI is a collection of enterprise-grade UI components delivered by Infragistics to accelerate the creation of popular functionalities required for doing business online. Thus, it is not surprising that it includes Data Grid and Spreadsheet components.
Just like other JavaScript data tables, the Ignite UI Data Grid component comes with a pack of common grid features such as editing, filtering, sorting, paging, column fixing, summaries, exporting to Excel, etc. Although it lacks such demanded functionality as row and column drag-n-drop and undo/redo. But at the same time, this component gives you the opportunity to customize many of its features:
- Enable multi-criteria data filtering across columns with the Filter by Text feature,
- Specify your own grouping criteria,
- Add custom aggregation functions for creating required summaries,
- Fix columns to the right,
- Modify the paging behavior (page size, show/hide size drop-down, show/hide paging buttons), and change styling for page buttons.
Apart from that, you can also make use of multi-column headers, cell merging, row selectors, unbound columns, etc. Using templated columns; it is possible to add a custom data format, buttons, or sparkline graphs to your grid. The component also supports live data updates. Built-in DOM virtualization helps process large volumes of data without delays. This Data Grid allows taking advantage of popular open-source libraries such as KnockoutJS, History.js, JsRender, and Bootstrap.
The Ignite UI spreadsheet component is designed to give an Excel-like way of visualizing and managing tabular data. It is supported by the Infragistics Excel library, enabling you to import and export data to and from Microsoft Excel files and use most of the Excel objects. As a result, you get access to the following features:
- Built-in Excel formulas (the engine supports 100 functions) and the ability to create custom ones,
- Formula bar for reading cell content and formulas (and creating your own based on spreadsheet data),
- Editing possibilities and data validation,
- Predefined and custom filters,
- Configurable view i.e. you can hide some elements (gridlines, headings, or the formula bar), split the spreadsheet into scrollable panes, freeze the first column or row),
- Zooming/scaling (lacks in Handsontable),
- Conditional formatting.
Similar to Handsontable, Ignite UI spreadsheet doesn’t comprise a built-in ribbon with controls for managing data from the UI.
Infragistics also provides several in-house tools to facilitate your experience with Ignite UI. You can speed up the delivery of apps using the App Builder tool with pre-built templates and preset screen layouts. The Theme Generator tool will give you control over the look and feel of Ignite UI components.
The technical peculiarities of utilizing these Ignite UI components are highlighted in the corresponding help and support documents.
Free trial version: Ignite UI
Price: from $1,095 (for a full package of Ignite UI components)
My opinion: Infragistics includes Grid and Spreadsheet in the list of the most popular Ignite UI components. But these tools do not have significant advantages over ag-Grid, Handsontable, and the rest of the products reviewed in this article. One more discouraging factor is the fairly high price of Ignite UI. Therefore, it may be a reasonable choice only if you decide to build your app entirely on the basis of Ignite UI.
Kendo UI for jQuery
Kendo UI for jQuery is a UI toolset provided by Telerik for addressing serious web development challenges such as data management. This library offers ready-made Grid and Spreadsheet components equipped with the features that are normally expected from such tools in web projects.
Kendo UI Grid is a responsive and performant jQuery component that stands out from the rest of the UI elements included in the library with more than 100 features. Let us go through the most significant of them:
- Column interactions (resizing, reordering, freezing, actions via context menus),
- Various editing scenarios (batch, inline, popup, and custom editing),
- Multiple sorting and filtering options,
- Data grouping,
- Paging (endless or virtual scrolling for displaying a large number of records),
- Hierarchical display of data,
- State persistence,
- Templates for customizing grid elements (toolbar, columns, and rows).
Kendo UI Spreadsheet is primarily intended for bringing Excel or Google Sheet-like experiences to desktop apps. That is why you can face some performance and functional limitations when using it on mobile devices. Here are the main features of this jQuery Spreadsheet:
- Predefined and custom formulas (from standard to array formulas),
- Sorting and filtering,
- Cell formatting,
- Custom cell editors,
- Images and comments in cells,
- Validation.
You have an opportunity to improve the performance of Grid and Spreadsheet components with the Kendo UI templates. You can also take advantage of other shared features such as export to PDF and Excel, keyboard navigation, localization, and themes.
You can get a deeper insight into both components by visiting documentation and demo pages provided by the Kendo team.
Free trial version: Kendo UI
Price: from $899 ( for a full package of Kendo UI components)
My opinion: Kendo UI Grid and Spreadsheet components offer common features for implementing corresponding functionalities on a web page, but they will hardly give you an edge over other components in achieving these goals. If the work on mobile devices is important for you, the limitations of the Spreadsheet component mentioned above may also be an issue. But maybe you should give these components a try before making the final decision.
GrapeCity’s JavaScript UI Components
In our quest for suitable replacements for Handsontable and ag-Grid, I should mention corresponding products from GrapeCity.
FlexGrid is a lightweight (about 150KB in size CSP-compliant JavaScript data table from GrapeCity’s Wijmo library of UI components. By default, FlexGrid comes only with core Excel-like features such as sorting, formatting, editing, and grouping. More complex features and customizations are implemented via extensions and a flexible API. Here is a summary of other FlexGrid capabilities:
- Customizable cells (with templates, dynamic updates, conditional formatting, etc.),
- Automatic lookup capabilities with the DataMap feature,
- Multiple filtering options,
- Data summaries,
- Freezing and pinning of rows and columns,
- Modifiable layout (reordering, cell merging, column resizing),
- Master-detail model for viewing hierarchical data (lacks in ag-Grid),
- Exporting (PDF (lacks in ag-Grid), Excel), and printing.
Free trial version: FlexGrid (Wijmo)
Price: from $699 (for a full package of Wijmo UI components)
SpreadJS is a suite of JavaScript spreadsheet controls provided by GrapeCity as a stand-alone solution for bringing Excel strengths into a web project. In addition to commonly used features, it also provides some unique opportunities like barcodes, rich text, cell buttons, slicers, status bars, copy/paste Excel styles, and date ranges. But there are several features that deserve special attention:
- Calculation engine with 500+ formulas,
- Optimized for high performance (e.g. populating two million cells in less than a second),
- Support for pivot tables,
- Multiple chart types and sparklines for visualizing table data.
Moreover, you can also benefit from the SpreadJS Designer tool that allows building complex spreadsheet layouts from scratch or edit existing Excel files without any code manipulations.
Free trial version: SpreadJS
Price: from $1499
Various learning resources (documentation+samples+demos) will help you not to get confused in these UI components.
My opinion: These components have everything to replace Handsontable and ag-Grid and even more. The only stumbling block here is the licensing and pricing strategy of GrapeCity. FlexGrid is offered only in combination with other components in the Wijmo library, while the stand-alone SpreadJS component is rather expensive.
Final Words
Handsontable and ag-Grid are good software solutions, but it is necessary to have a plan B up your sleeve to be able to quickly adapt to any twists and turns of the development process. In this article, you can certainly find suitable alternative options for embedding data tables or spreadsheets into your web app. But whatever is said above, the final decision is yours. Good luck with all your coding ventures.
Opinions expressed by DZone contributors are their own.

Comments