2 Ways to Integrate JMeter Tests Into Jenkins
Learn how to integrate your JMeter tests into Jenkins by working directly with JMeter or running a Taurus test in Jenkins.
Join the DZone community and get the full member experience.
Join For FreeAs performance testers, we contribute to our development team by easing the execution of performance tests. The goal is to integrate testing to make it a natural part of the lifecycle of any development project. In this blog post, we will see how to integrate our open source JMeter performance tests into open source Continuous Integration tool Jenkins. We will go over two different options and explain when it is better to choose each one.
The two options are:
- Working directly with Apache JMeter™ in Jenkins. This option is for cases when the tester runs JMeter using the console mode.
- Running a Taurus test in Jenkins. This option provides more flexibility in the test configuration. It can also connect you to BlazeMeter reporting.
A third option is to run your performance test in BlazeMeter, easily integrate it into Jenkins with the BlazeMeter Jenkins Plugin, and use the built-in performance testing graphs there.
In my examples, you will see that I use different paths (I'm using Windows), so let me first explain what each of them mean so you can follow my guidelines with your own folders.
- C:\apache-jmeter-4.0\bin\: Path to my JMeter bin folder.
- C:\Jenkins: Path to my script (JMX file).
- C:\Jenkins\Report: Path to my Report folder.
- blazedemo.jmx: my JMeter script.
We assume you already know how to write your script in JMeter. If you need more assistance, you can learn from the free online JMeter academy.
We can integrate our JMeter load test directly into Jenkins by using the command line (Shell in Linux, or in my case, a batch command in Windows):
Extract your JMeter bin folder.
In Jenkins: create a Freestyle project.
In Jenkins, go to the Build tab and add a build step: Execute Windows batch command or Execute shell if you are using Linux:
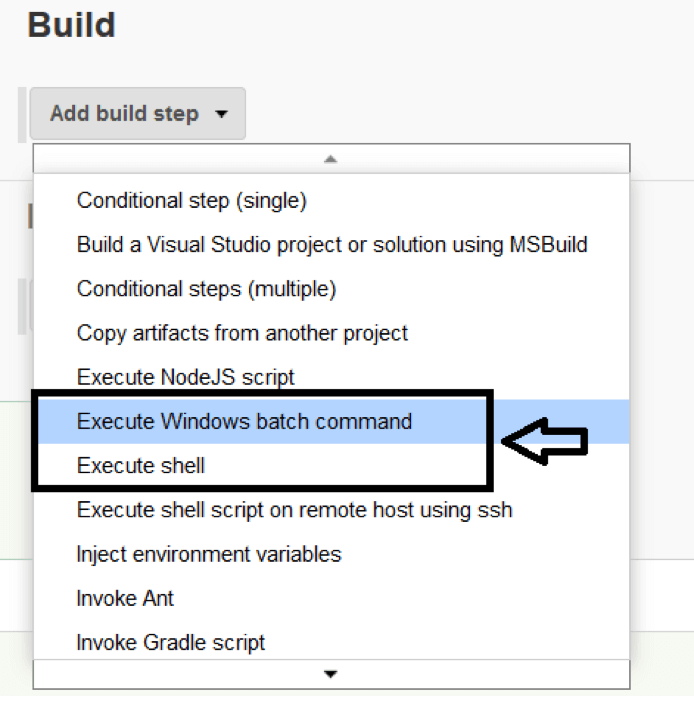
Add a command with a link to your extracted bin folder and the path to your script. (The JMeter test will be run in non-GUI mode. Learn more about how to run JMeter like this from here).
C:\apache-jmeter-4.0\bin\jmeter -n -t C:\Jenkins\blazedemo.jmx -l C:\Jenkins\Report\result.jtl
The results will appear in your Result folder under the name you have set, in this example: result.jtl
You can also update JMeter script values. For example, Jthreads is a property that defines the number of threads. Configure the property in JMeter and update the script in Jenkins.
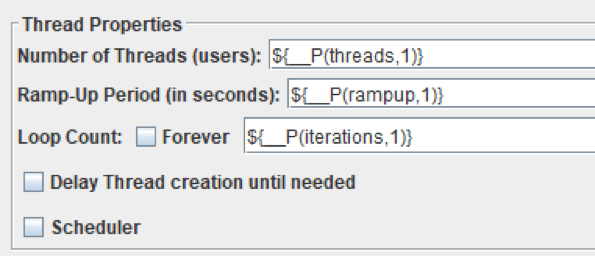 C:\apache-jmeter-4.0\bin\jmeter -n -t C:\Jenkins\blazedemo.jmx -Jthreads=2 -l C:\Jenkins\Report\result.jtl
In Jenkins, it will look like this:

In JMeter, add jmeter.save.saveservice.output_format=xml to the user.properties file (located in the /bin folder of your JMeter installation), to allow JMeter to publish the results in XML format. These results will then be published by Jenkins in the Performance Trend report that we show below.
As mentioned in this blog post "Using Continuous Integration to Detect Performance Degradation," by integrating a performance test into CI tools like Jenkins, we:
- Get feedback on time
- Gain confidence in our build
- Learn more about the aspects that make our system fail, in time, in order to avoid having the same error happen in other areas of our application.
Therefore, it becomes important for us to quantify the test results for each test build through comprehensive graphs. Even better, we should be able to easily analyze the most common KPIs, like response time, throughput, and error results.
To achieve this let's install these two Jenkins plugins:
Go to Jenkins -> Manage Jenkins -> Manage Plugins -> Available Tab and find the plugins.
These plugins will help you to graph (Plot) the results and set up the test (Performance). So this step is the first thing you should do for any integration option. Read more about the Jenkins Performance Plugin here.
In Jenkins, in Post-build actions -> Publish Performance test result report - Add the same path to the jtl that you specified in the build. So, the Jenkins report will read the information to show from the JMeter report you have specified.

In Jenkins, go to the advanced options:
- Click on "Display Performance Report with Throughput" if you want to also see this graph.
- If you want to display the performance Report per test case, you just need to check this option.
- The Fail Build option is checked by default.
All the other setting names are quite self-explanatory.

Save and Build.
If everything went well, you will see the build and the Performance Trend created.
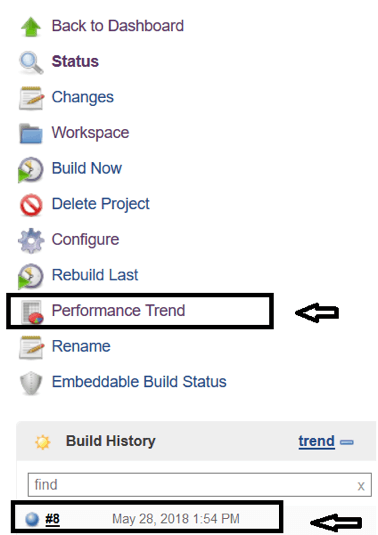
You will also see a quick view of the results in the main Project dashboard as shown below:
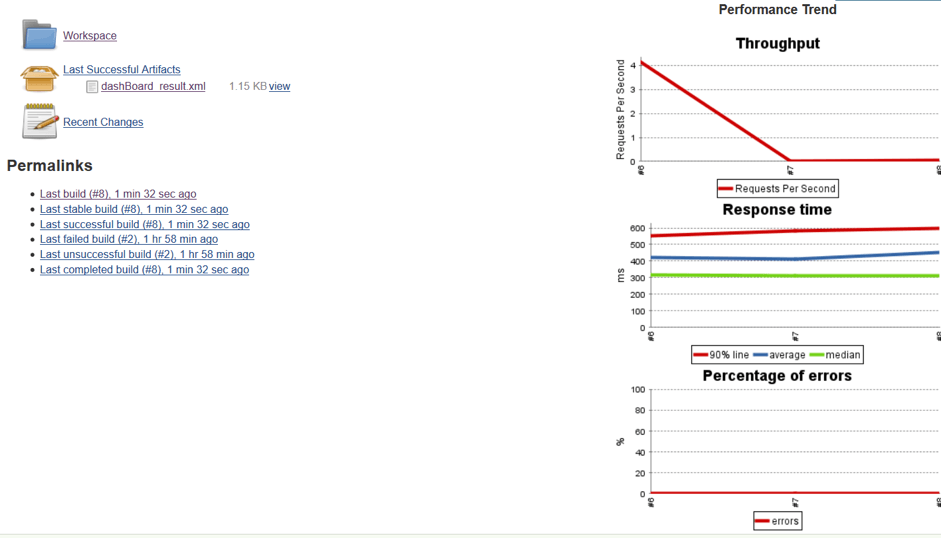
If you go into Performance Trend menu, you will see these three graphs and also a link that takes you to the Last Report.
As I have said before, these KPIs are very useful for test results analysis:
- Throughput: It's important to analyze this value if it changes because this could be a symptom of a possible problem.
- Response time: In order to keep good application performance, it's important to monitor the times in your dashboard. If the times increase, you should check the last commit or build, and check what changed in your app.
- Errors: If the number of error increases, you should review the last changes made in your application and your script. Remember that app changes could break the script.
Here, as an example, you can find a table similar to the JMeter Aggregate report, that you can find in Last Report of the Jenkins Performance Report. This report has labels that show you how the results change in comparison with the previous build:

Finally, you can review the values of the Last Successful Artifacts with data as Average, Median and Percentile Response Time.
Another way to integrate JMeter in Jenkins is by using Taurus, an open source test automation framework for easily running performance tests.
The advantages of running Taurus+JMeter from Jenkins (compared to just JMeter from Jenkins):
To do this you have to:
1. Install Taurus.
2. If you don't have JMeter, the Taurus build will install it for you. If you already have JMeter in your Jenkins host, add JMETER_HOME to your PC environment variables.
3. In Jenkins: create a Freestyle project.
4. Go to the Build tab and add a build step: Run Performance Test.
Fill in the Taurus tool parameters:
C:\Jenkins\blazedemo.jmx -o execution.0.concurrency=40 -o execution.0.iterations=1 -o execution.0.ramp-up=10s -report
This scenario executes 40 users, 1 iteration, and plugged in the users in the first 10 seconds of the test.

With this option, you can easily set up the scenario to configure the build.
Even better, in Jenkins, you can define three string variables: CONCURRENCY, RAMPUP, ITERATIONS.
Define these variables in the general option of the project "This project is parameterized" and then in the build line write:
C:\Jenkins\blazedemo.jmx -o execution.0.concurrency=$CONCURRENCY -o execution.0.iterations=$ITERATIONS -o execution.0.ramp-up=$RAMPUP -cloud
During build time, when you run the test, Jenkins will ask for these values:
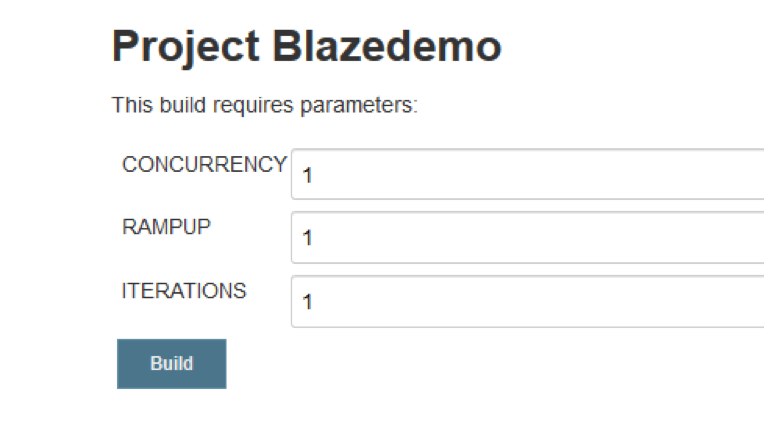
As a variant of the option -o execution.0.iterations=1 you could use -o execution.0.hold-for=2m or the time you would like to hold the test. So the test will run until that set time, iterating the actions. Also, in the same way, you could parametrize the hold-for value.
Save and Build.
If everything went well you will see Taurus running in the console output.
The command -cloud added before, will generate an External Report, so not only will you have the Performance Report but you also will have a BlazeMeter Report clicking over "View External Report."
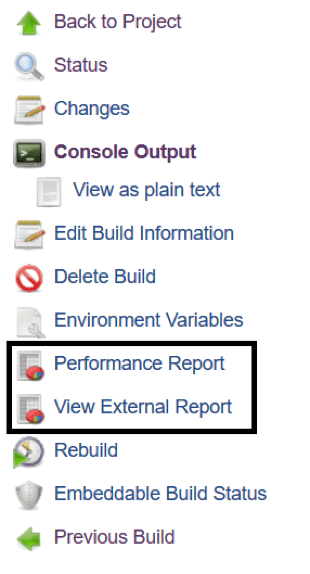
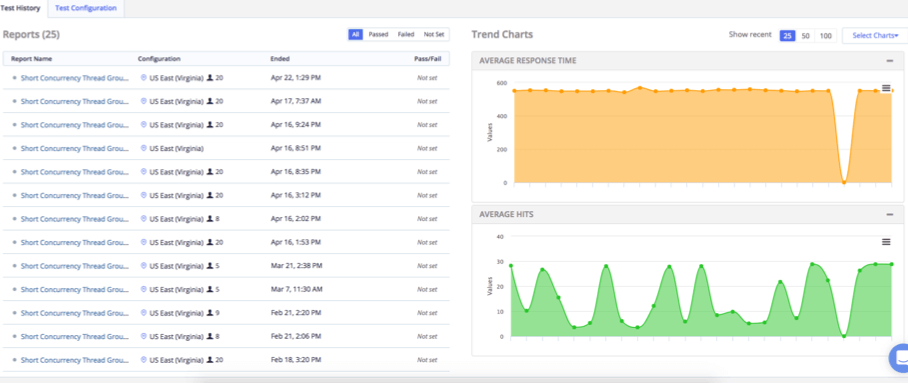
Click on it and BlazeMeter will open up for you. BlazeMeter provides many insightful KPIs in colorful graphs. You can also drill down analyze to labels or geo-locations, both in real-time and for results collected and stored over months.

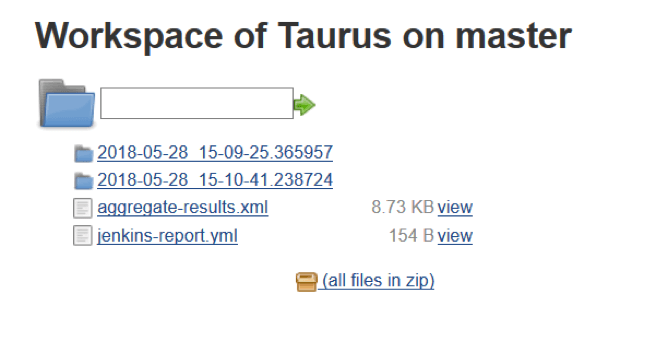
I like how the Taurus option manages the Jenkins workspace, creating a folder for each build. You can access the logs and KPIs of your execution in an easy way.
As you can see, the first option is easy to configure for people who are used to using the JMeter command line. But, in both options, you could set up the scenario in a flexible way without having to edit or modify the script.
Share your favorite integration option with us in the comments section! I hope this blog helps you set up your tests in Jenkins, and more importantly that it helps you to add your test to the CI lifecycle.
To learn how to create a Taurus script and run it in Jenkins, click here. You will get additional abilities:
- Setting test failure criteria using the passfail module of Taurus
- Running shell commands in the prepare/startup/shutdown/post-process of the test using the ShellExec Service of Taurus
Published at DZone with permission of Leticia Almeida, DZone MVB. See the original article here.
Opinions expressed by DZone contributors are their own.

Comments